A Rising Wedge (Ascending Wedge) is a bearish pattern that usually marks a reversal in an uptrend. In a downtrend, the Rising Wedge is considered as a continuation pattern. As with other triangle formations, the volume usually diminishes as the price rises and then increases during a breakout. The Rising Wedge appears in a mature trend characterized by overbought long-term and short-term indicators. This situation usually generates Divergence on long-term indicators. The height of the formation is the distance between the support and resistance lines at the beginning of the triangle formation (AB). Usually the breakout price's change (CD) approximately equals the height of the pattern formation.
|
Psychology of the Rising Wedge Pattern
|
The support trend line presents the buyer's sentiments, while the resistance trend line represents the seller's sentiments. The steepness of the Support/Resistance Trend Line indicates the buyers/sellers enthusiasm. In a Rising Channel pattern, the slope of support and resistance trend lines is the same, since buyers and sellers have the same level of confidence in the trend direction. In a Rising Wedge formation the support line has a steeper slope than the resistance line, since sellers have more pessimistic view on the direction of the trend. This conflict of expectation creates an uncertainty that is not sustainable and usually resolves in the price outbreak.
|
Example: Rising Wedge (Ascending Wedge) in Uptrend
|
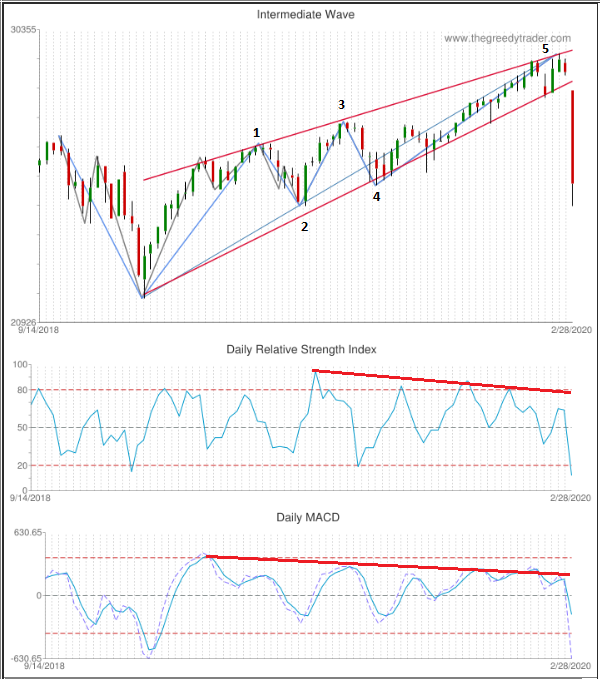
The chart below presents an example of the Rising Wedge pattern in the Dow Jones Industrial Average (^DJI) monthly wave that started on December 26, 2018 at 21,712.53 and reached 29,568.57 on February 12, 2020, making more than 36% gain in less than fourteen months. The height of the Rising Wedge formation (the difference between the resistance and support line at the beginning of the wave) is 3,685.4. This Rising Wedge pattern appeared in the third sub wave of the Dow Jones quarterly wave that started on July 24, 2015 at 15,370.33 and made more than 92% in four and a half years. The daily Relative Strength Index and MACD have bearish divergence. The Rising Wedge breakdown had started on February 12 and reached 25,409.36 in eleven business days, losing 4,159.21, or more than 14%. The breakdown is approximately equals (113%) to the height of the formation.
|
| ^DJI: Dow Jones Industrial Average |
|
How to Trade a Rising Wedge (Ascending Wedge) Pattern
|
There are several different strategies of trading the Rising Wedge pattern. They have different risk/reward ratio. You can select the technique that better match you trading style or combine several different strategies to identify the trade entry and exit points.
When to enter the market:
- Sell below the support line: Some traders recommend placing a sell order when the market closes below the support line and to set a stop loss order right above the broken support level. This technique has a good risk/reward ratio, but the entry signal might be quite noisy and give false signals too often.
- Sell when the support line turns into resistance: Another strategy suggests selling when the price, after closing below the support line, finds resistance at the former support line and closes below the new resistance line. The advantage of this technique is that you may sell stock at a higher price, since the support line is moving up, but on the other hand, on a sharp breakdown, the price may not retest the former support line at all, and you will miss an entry point.
- Sell on resistance below the support line: More cautious traders prefer to wait till the price breaks the next support level below the support trend line, and they want to see that this latest broken support is retested and became the new resistance. They place a sell order when price moves below this second support level and set a stop loss order above the support.
When should you take profits:
It is usually considered that a price breakdown approximately equals the height of the pattern formation (see line AB on Pic. 1 above). Traders usually use this assumption to calculate a potential price target. In addition, traders consider each bottom on a Rising Wedge formation as a potential support level. Traders may take profit if they consider that support level is holding and might cause the price reversal.
|
Rising Wedge Screening
|
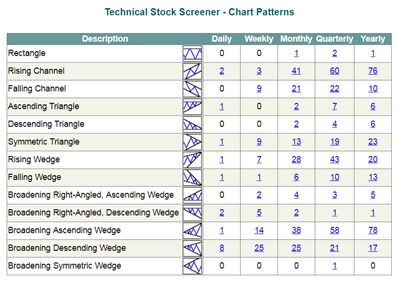
There are several different ways of using TheGreedyTrader.com website to find a list of stocks that are forming a Rising Wedge Pattern. The simplest way is to use the Technical Stock Screener - Chart Patterns screen that you can find under the Alerts=>Chart Patterns menu. The Chart Patterns stock screener has links to a predefined screener of the daily, weekly, monthly, quarterly, and yearly Rising Wedge stocks.
|
|
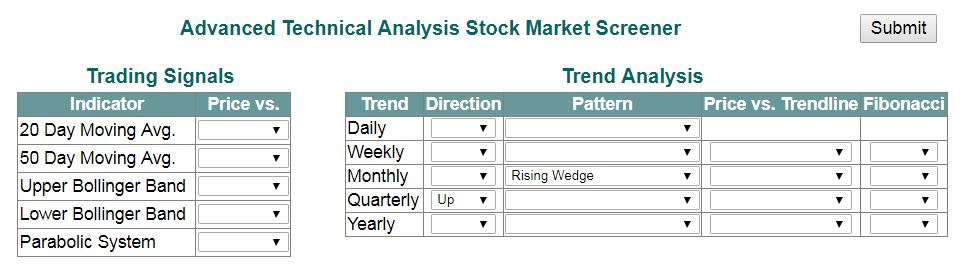
To customize the search criteria, you can go to the Advanced Stock Screener under the Analysis=>TA Search menu. Under the "Trend Analysis" section, you can select the Rising Wedge pattern as well as the trend direction, the Fibonacci retracement range, and specify if the current price is within the wedge trend line range, testing a trend line, or it has broken the support/resistance level.
|
|
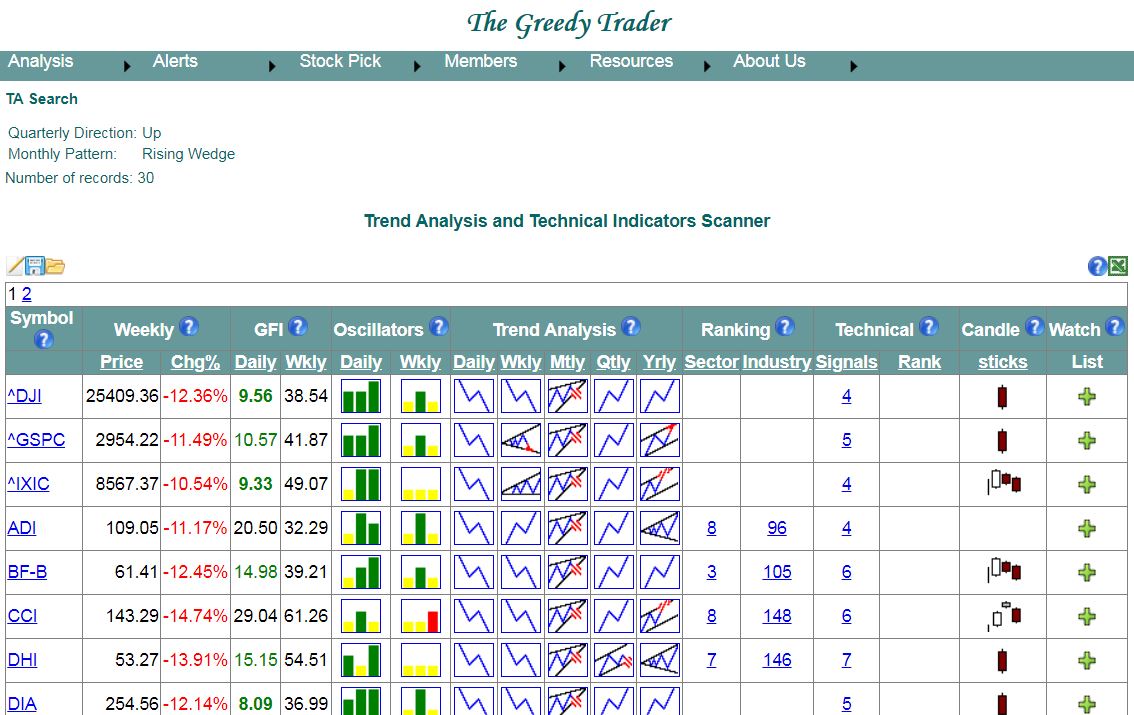
After submitting a search criteria, you will be redirected to the "Trend Analysis Scanner" page that will give you the list of S&P 500 members matching your selected criteria.
|
|
The Rising Wedge pattern's icons that appear on the Trend Analysis column present the following:
|
 - Valid Rising Wedge pattern - Valid Rising Wedge pattern |
 - Rising Wedge broken support trend line - Rising Wedge broken support trend line |
 - Rising Wedge broken resistance trend line - Rising Wedge broken resistance trend line |
 - Rising Wedge near the support trend line - Rising Wedge near the support trend line |
 - Rising Wedge near the resistance trend line - Rising Wedge near the resistance trend line |
You can find more details at Advanced Stock Screener
|
|
| Predefined Screening |
| Weekly Rising Wage Pattern Screener |
|