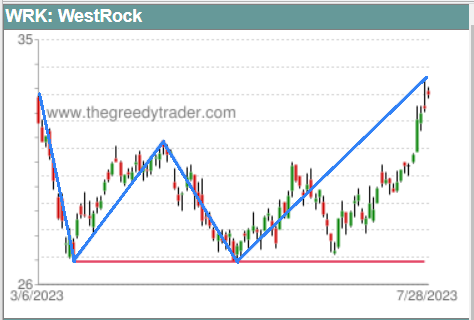
A double bottom is a charting formation that indicates a reversal in a downtrend. The pattern resembles a letter “W”. A downtrend reaches the same bottom price twice, forming an intermediate local high in between these two bottom points. The bottom price level becomes a significant support level that marks the end of the downtrend and the beginning of the uptrend. The price of the double bottom pattern often rises to approximately the high price of the initial downtrend. This price level is usually considered as the price target of the double bottom pattern. A double bottom is a common pattern that can appear in different time frames. A drop below the support level of the double bottom invalidates the pattern and suggests the continuation of the initial downtrend.
Our
Chart Patterns Screener allows users to see a list of stocks that formed a double bottom chart pattern in daily, weekly, monthly, quarterly and yearly time frames. The presence of the double bottom pattern in the stock’s price time frame is indicated with the following icon -

.