| Home > Technical Analysis Tutorial > Chart Patterns
|
| Chart Patterns
|
|
|
Falling Wedge Pattern
|
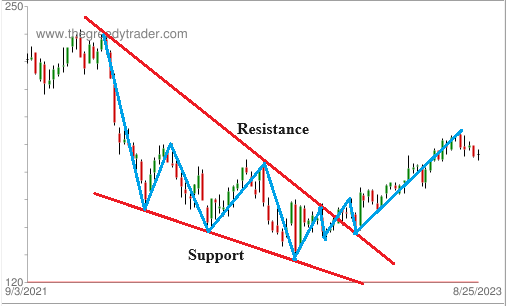
A falling wedge, also known as the descending wedge, is usually considered a bullish pattern. The pattern often appears in a downtrend as a signal of an upcoming trend reversal. In a rising trend, the falling wedge is usually considered a continuation pattern. The connected lows of the formation represent a support trend line, while the connected highs of the pattern present a resistance line. The highs and lows of the pattern are moving lower, but the highs are moving down at a noticeably higher speed. The converging falling support and resistance lines form a downward-pointing triangle. The pattern is an inversion of the rising wedge pattern.
A falling wedge pattern is considered a bullish signal with a higher probability of an upward breakout, but traders usually watch other technical indicators to confirm the breakout direction. Moving averages, Relative Strength Index (RSI), MACD, bullish divergence, and Fibonacci retracement techniques are very helpful in analyzing the falling wedge pattern behavior. Considering technical indicators, chart patterns, and support and resistance levels in the bigger time frame is extremely important.
In a rising trend, a falling wedge pattern may appear after a temporary price retreat. As a bullish pattern, when a falling wedge appears in a rising trend, it is considered as a continuation signal.
After the breakout, when the price moves above the resistance line, it becomes a new support line and the price often retests the former resistance line before moving up toward the price target. In case the price moves below the support line, it becomes a new resistance line and might be retested as well.
|
Psychology of the Falling Wedge Pattern
|
A falling wedge pattern is usually formed at the end of a previous downtrend when supply and demand reach a balance. Buyers and sellers are exhausted and not willing or able to significantly move the price toward the upside or downside. The price is moving in a range between support and resistance lines. Technical indicators from strongly oversold and overbought areas make higher highs on each new lower low, showing bullish divergence. The support line moves down at a much lower speed than the resistance line, since big institutional players and smart money traders start buying large portions of shares on each new low. The market is in the accumulation stage before the breakout occurs.
A falling wedge pattern may appear in an uptrend as well. It usually happens when, after a substantial rally, bulls are exhausted and bears take temporary control. The price retreats and the market enters a consolidation period. Big players use the consolidation period to get into their larger positions while the price is moving in a range before a breakout.
|
Falling Wedge Stock Screener
|
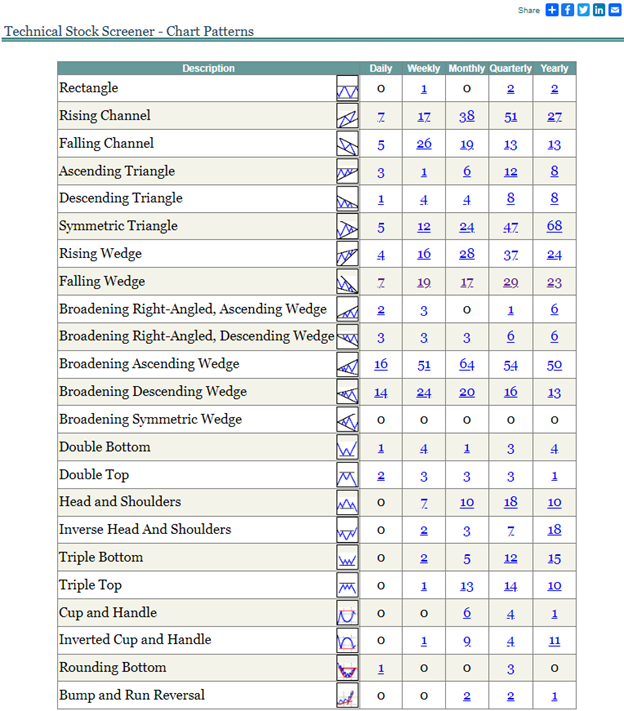
The easiest way to find a list of stocks/ETFs that form a falling wedge pattern is by using a Technical Stock Screener – Chart Patterns page. It shows a grid with a list of recognized chart patterns in daily, weekly, monthly, and yearly time frames. One line of the grid is dedicated to the falling wedge pattern. It shows the number of recognized patterns for each time frame. Users can click on the number link to see the Scanner page with the detailed list of securities that match the search request.
|
 |
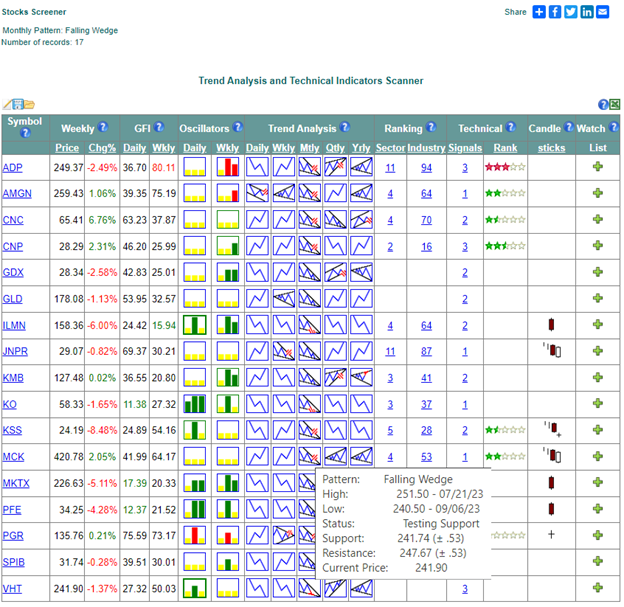
Below is an image of the Scanner page for the monthly falling wedge patterns. The selected criteria are displayed in the left top corner of the screen. The Trend Analysis columns show the recognized pattern’s icon for each of the five time frames. The icon indicates the pattern status as well
 - A valid Falling Wedge pattern with price in the trading range. - A valid Falling Wedge pattern with price in the trading range. - A Falling Wedge broken resistance trend line. - A Falling Wedge broken resistance trend line. - A Falling Wedge near the resistance trend line. - A Falling Wedge near the resistance trend line. - A Falling Wedge near the support trend line. - A Falling Wedge near the support trend line. - A Falling Wedge broken the support trend line. - A Falling Wedge broken the support trend line.
If the user moves the cursor over the icon, the popup toolbar shows the pattern's detailed information: pattern name, status, low and high levels, current price, and current support and resistance level.
The Oscillators column shows daily and weekly oscillator icons with green or red vertical bars to indicate technical oversold or overbought conditions. The green or red border around the icon indicates the bullish or bearish signals. The user can move the cursor over the oscillator’s icon to see the signal’s details.
|
 |
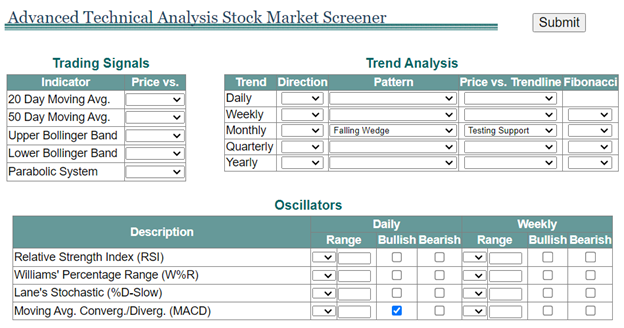
If the user wants to search for the falling wedge with more specific technical criteria, he or she can use the Advanced Stock Screener. It allows one to select a chart pattern for one or several different time frames as well as the pattern status. In addition, users can select the price level vs. moving average, Upper or Lower Bollinger Band, or/and Fibonacci retracement level. The required Relative Strength Index (RSI), Williams’ Percentage Range, Lane’s Stochastic, and Moving Average Convergence/Divergence (MACD) range, and bullish and bearish divergence can be included as search criteria as well. The page below shows the selection for the monthly Falling Wedge pattern with the price testing support and bullish MACD
|
 |
If the user clicks the Submit button with the selected above search criteria, the next Technical Scanner page will show the selected criteria in the left top corner of the screen and the list of stocks that match the selected criteria below.
|
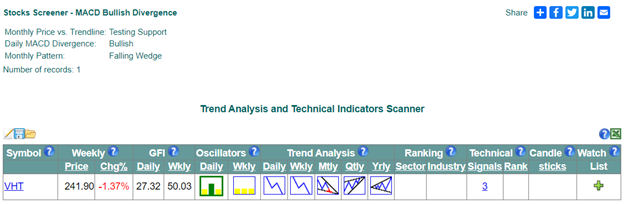 |
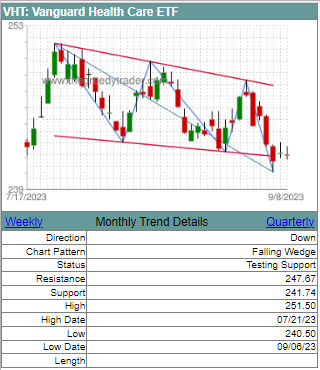
The monthly Trend Analysis column shows the falling wedge icon with selected ‘testing support’ status and green border around the daily Oscillators column that indicates the MACD bullish divergence according to the selected criteria. The user can click on the monthly pattern icon to see the Trend Details screen that shows the pattern price chart and pattern details including pattern name, direction, status, low and high, and current support and resistance level.
|
 |
Trading Falling Wedge Pattern
|
There are several steps that should be performed after identifying a falling wedge pattern in order to master a successful trade. First of all, other technical indicators and signals should be reviewed. Some technical signals, such as strongly oversold oscillators at the beginning of the pattern and bullish divergence, usually come together with a falling wedge and may confirm the pattern and make the signal more reliable. The longer time frame patterns, support, and resistance levels may provide additional clues regarding the future price movement.
The next step is waiting for the pattern breakout. Usually, traders watch for the breakout confirmation signals. The price movement should be sharp with substantial volume expansion and a daily close above the resistance line. It often appears with a long white candlestick. Some traders wait until the price breaks above the previous pattern’s high level as a breakout confirmation. During a breakout, technical indicators usually move sharply into a strongly overbought area that may sometimes cause a correction to retest the former resistance line.
After the breakout confirmation, traders can estimate their risk/reward ratio and enter the trade. At this point, a stop-loss order should be placed to minimize the risk of potential failure of the pattern. Some traders place the stop-loss order below the support line, while others place it within the wedge just below the former resistance line. The higher the traders’ stop-loss, the lower the risk/reward ratio, but at the same time, the higher the probability that an unexpected price move will stop their trade. After opening the trade, traders can estimate the price target and exit strategy.
|
Falling Wedge Price Target
|
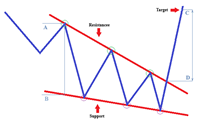
The image on the left shows how to calculate the falling wedge pattern price target. The distance between points A and B equals the height of the widest part of the wedge. Adding this distance to the breakout level (D) gives the estimated target price level ©. Similarly, to calculate the price target for a down breakout, the height of the widest part of the wedge AB should be subtracted from the breakout price. According to the “ Encyclopedia of Chart Patterns” by Tom Bulkowski, the price breakouts are up 68% of the time and meet the target of about 62% and about 29% for down breakouts with an average profit of about 38%.
The question is how we can conclude that the target is not met and how to exit the trade in this case. The market price always fluctuates and will move in the opposite direction for a while. It does not necessarily mean that the target will not be met. If, for example, after the breakout of a monthly falling wedge pattern, a weekly price wave moves in the opposite direction, a trader should stick to the plan and wait for the target price. In this example, only if the monthly wave turns in the wrong direction before reaching the target price, we consider that the target was not met. In this case, a trader should use other techniques to close the open transaction. In the up breakout example above, the price crossing below the 100-day moving average signal can be used as a sell signal. Other technical signals, such as Parabolic SAR System, can be used to exit the trade in this case as well.
|
Falling Wedge Examples
|
The image below shows a real-life example of a falling triangle formed on a price chart of The Pioneer Natural Resources Co. (PXD) between March 17, 2023, and June 27, 2023. The price formed a falling resistance line with three lower highs during this period: $232.12 on March 17th, $216.76 on May 23rd, and $209.32 on June 7th, and a downward support line with three lower lows: $200.69 on May 17th, $198 on June 1st and $196.88 on June 23rd. The support and resistance lines were converging. Daily oscillators and MACD formed a bullish divergence. The height of the widest part of the wedge equals $27.78. On June 28th, 2023, the price broke the pattern resistance line at $201.55 forming a long white candlestick and making a 1.85% gain in one day. The target price equals $201.55 + $27.78 = $229.33 was reached on August 3rd making a 13.78% gain in 25 business days.
|
 |
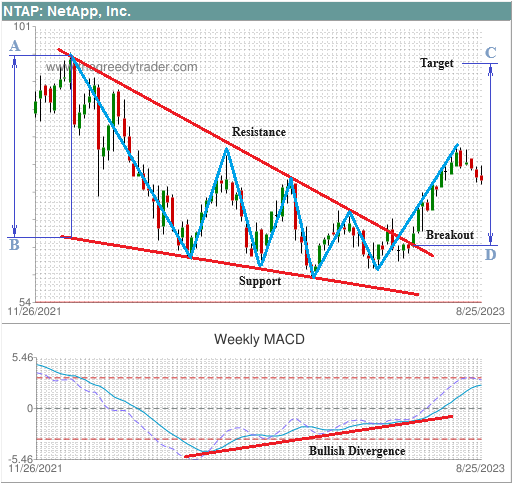
The falling wedges pattern on a quarterly rising trend below was formed on the price chart of NetApp, Inc. (NTAP). The falling resistance line made by four lower highs converged with the moving down support line made by three lower lows forming a falling triangle. Weekly MACD had a bullish divergence.
|
 |


|