The Greedy Trader Weekly Analysis
Sign In Apr 12, 2024
Skip Navigation Links
Share

Daily Candlestick Patterns

Skip Navigation Links.
 Type  Candles  Candlestick Patterns  Count 
Bullish 1Doji25
Long White Real Body11
2Doji Star View Help2
Harami Cross2
Homing Pigeon View Help4
Matching Low View Help1
Meeting Lines View Help10
Piercing Line View Help5
3Three Inside Up View Help2
Upside Tasuki Gap2
5Ladder Bottom2
Bearish 1Long Red Real Body50
2Dark Cloud Cover14
Harami1
On Neck1
Thrusting5
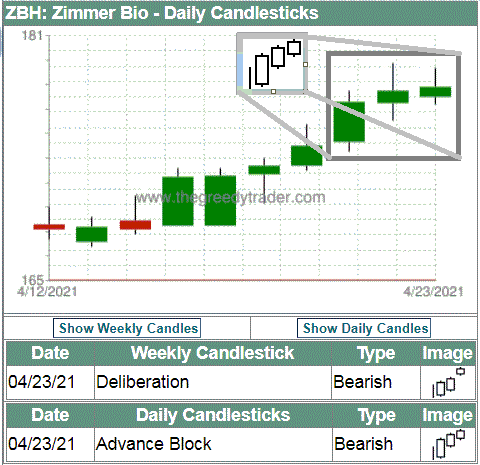
3Advance Block2
Deliberation13
Downside Tasuki Gap12
Three Black Crows5
5Falling Three Methods5
Help

Candlestick Patterns

Candlestick Patterns The candlestick patterns performance ranking analysis was presented in 2008 by Thomas Bulkowski in his book "Encyclopedia of Candlestick Charts". His research was performed on a collection of data that contained the prices of the 500 stocks of the S&P 500 index over 10 years, and covered over 100 candlestick patterns. The general statistics presented in the research include performance over time, where performance is best, and where reversal or continuations are most likely to appear in the yearly price range.

Many traders prefer Candlestick charts and consider them easier to interpret than the traditional Bar Charts, which show the same information, just in a different way. Each candlestick provides a clear visual picture of price movement between market open and close, as well as lows and highs.
Warning: TheGreedyTrader.com presents weekly analysis. Technical indicators and trend parameters are calculated for the close of business day indicated on the top right corner of the screen.