| Home
|
Technical Analysis Tutorials
Technical Analysis Introduction
|
Technical analysis is a set of different techniques to forecast the future price by using mathematical analysis of the past price action. Technicians do not analyze the reasons why the price is going up or down. Technical tools often allow analysts to identify the market trends and turning points when nobody seems to know exactly why the market moves in a certain direction.
|
Technical Indicators and Signals Tutorial
|
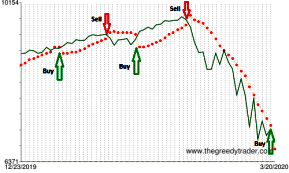
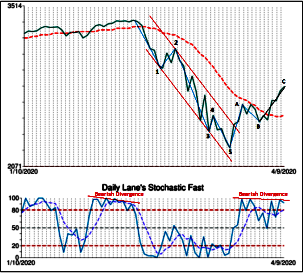
Technical Indicators and Signals are mathematically-based technical analysis tools. They measure the strength of the dominant market groups and can be used to enhance your ability to interpret and analyze past price movements and anticipate future price trends. Technical Indicators help to quantify and visualize signals and triggers that are often used to execute trades.
|
Chart Patterns Tutorial
|
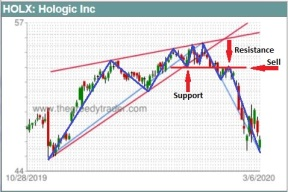
Chart patterns are one of the most powerful Technical Analysis tools. The patterns of prices actually represent and visualize the repeating patterns of the group's behavior. Using the chart patterns technique can help you to assess market conditions, determine entry points, set price targets, and manage your risk.
|
Candlestick Patterns Tutorial
|
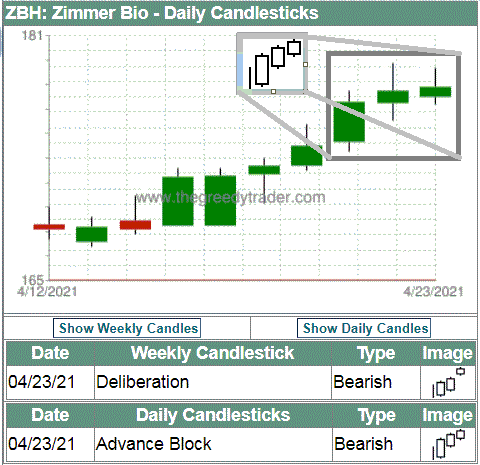
A candlestick chart is one of the oldest forms of technical analysis which provides an effective visual representation of the price movement; it is used to analyze the market psychology and predict the short-term market direction. Candlestick charts were developed in the 18th century in Japan and were introduced to Western traders in 1991. Candlestick patterns can be used to recognize the emotions that are driving the market price and identify the trend reversal points.
|