|
|
The Greedy Trader |
Weekly Analysis |
|
|
|
|

|
|
|
|
|
|
|
Technical Stock Screener - Fibonacci Retracement
| |
|
|
|
|
|
| Description | Daily | Weekly | Monthly | Quarterly | Yearly |
|
23.6% Fibonacci Retracement
|
|
|
55
|
39
|
45
|
47
|
42
|
|
38.2% Fibonacci Retracement
|
|
|
25
|
43
|
26
|
30
|
19
|
|
50% Fibonacci Retracement
|
|
|
17
|
17
|
13
|
13
|
13
|
|
61.8% Fibonacci Retracement
|
|
|
12
|
8
|
16
|
12
|
10
|
|
|
|
|
 |
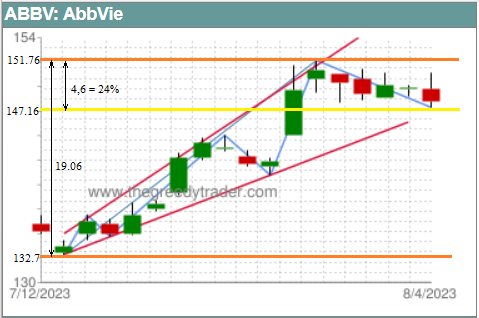
Fibonacci Retracement |
 Fibonacci Retracement is a popular trading technique that is based on a sequence of numbers called Fibonacci numbers. These numbers were introduced to the West by the Italian mathematician Fibonacci in the 13th century. The technique suggests that the ratio between two consecutive market price waves tends to be close to the ratios of 23.6%, 38.2%, 50%, 61.8%, and 100% between the Fibonacci numbers. Fibonacci Retracement ratios indicate potential support and resistance levels and predict the pullback retracement level. It allows traders to set a trade target price and stop-loss orders. Fibonacci Retracement technique works better when used in combination with other technical analysis indicators and chart patterns.
|
|
|
| |
| | |
|
|