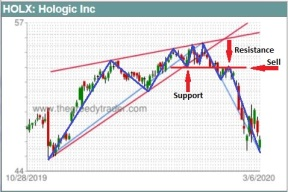
Chart patterns are one of the most powerful Technical Analysis tools. The patterns of prices actually represent and visualize the repeating patterns of the group's behavior. Using the chart patterns technique can help you to assess market conditions, determine entry points, set price targets, and manage your risk.