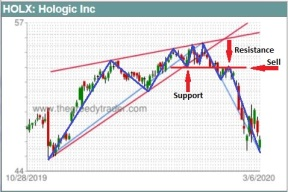
Chart patterns are noticeably similar formations that appear on price charts repeatedly for a variety of different securities and in different time frames. Chart patterns are one of the most effective technical analysis trading tools. They provide reliable, low risk, and high reward trading techniques. Unlike trend following technical techniques that provide lagging signals, chart patterns are leading indicators. They allow the user to predict the chart direction in advance.
Chart patterns occur repeatedly not by chance, but because of market psychology patterns: market participants in similar situations behave exactly the same way. So if a trader recognizes the pattern, he can understand the main forces that move the market, the balance of power, and the next price direction to position himself accordingly.
Most chart patterns can be divided in two categories: reversal and continuation. Reversal patterns signal a change of the trend direction. They appear at the top or at the bottom of the price chart. Continuation patterns appear when the price pauses or temporary retreats from the current trend, and signals that the previous direction will resume soon.
Chart pattern recognition is not a simple task. A common technique to identify a pattern consists of connecting a series of highs or lows to identify a trend line or curve. Trendlines are straight lines that help traders to identify the trend direction, areas of support, and resistance.