How to use Stock Screener |
|
Stock Screener is an essential tool that allows traders to wade through
thousands of stocks and return a dynamic list of stocks that match technical
and fundamental criteria. TheGreedytrader.com Stock Screener presents most
common fundamental and technical search criteria, as well as advanced unique
technical criteria which, to our knowledge, are not available in any other
stock screening tool.
|
|
Our stock screener includes the following sections:
|
|
|
|
|
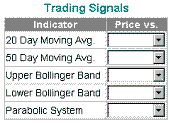
Trading Signals Stock Screener allows to find stocks that are
above, bellow or crossover the 20 Day Moving Average, 50 Day Moving Average,
Upper and Lower Bollinger Band and Parabolic SAR.
|
|
You can use the following predefined Trading Signals stock screener criteria:
|
|
|
|
|
|
|
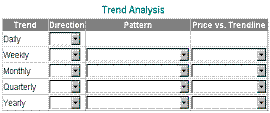
Trend Analysis Stock Screener allows to search trend parameters for daily,
monthly, weekly, quarterly and yearly trends simultaneously. It allows to
search for trend direction, price vs. trendline position (above, below or
crossover), and trend patterns. Trend patterns criteria include weekly, monthly
quarterly and yearly Ascending Triangle, Broadening Ascending Wedges,
Broadening Descending Wedges, Right-Angled, Ascending Wedge, Right-Angled,
Descending Wedge, Broadening Symmetric Wedge, Descending Triangle, Falling
Channel, Falling Pennant, Falling Wedge, Rectangle, Rising Channel, Rising
Wedge.
|
| You can use the following predefined Trend Analysis stock screener
criteria:
|
|
|
|
|
|
|
|
|
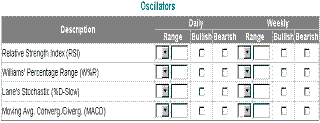
Oscillators, or Momentum Indicators Screener allow to search the following
overbought and oversold daily and weekly technical indicators: Relative
Strength Index (RSI), Williams' Percentage Range (W%R), Lane's Stochastic
(%D-Slow). You can select the daily and weekly Moving Average Convergence
/Divergence indicator (MACD) range in your search criteria as well.
|
| The following are the predefined Momentum Indicators stock screener
criteria:
|
|
|
|
| In addition to the technical indicator range criteria, the Momentum
Indicators Screener allows search for daily and weekly bullish and bearish
divergence. This functionality to the best of our knowledge is not available in
any other stock screening tool.
|
| The following are the predefined search criteria for bullish and
bearish divergence:
|
|
|
|
|
|
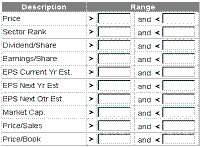
The Fundamental Stock Screener allows to search the following fundamental
criteria: Price, Dividend/Share, Earnings/Share, EPS Current Year Estimate, EPS
Next Year Estimate, EPS Next Quarter Estimate, Market Capitalization,
Price/Sales, Price/Book, P/E Ratio, PEG Ratio, Price/EPS Current Year Estimate,
Price/EPS Next Year Estimate, 1 year Target Price Growth%, Stock Exchange. In
addition you can use technical Sector Rank and technical Industry Rank in your
search criteria as well.
|
|
|
|
|
|
|
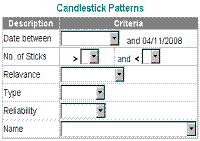
Candlestick Screener allows to select search day range within the last 5
trading days, pattern reliability (high, medium or low), pattern type (bullish
or bearish), pattern relevance (reversal or continuation), number of sticks in
the pattern. You can search for a specific candlestick pattern including the
following 26 patterns: Bearish Advance Block, Bearish Belt Hold, Bearish Dark
Cloud, Bearish Deliberation, Bearish Downside Tasuki Gap, Bearish Falling Three
Methods, Bearish Harami, Bearish Long Red Real Body, Bearish Meeting Lines,
Bearish On Neck, Bearish Separating Lines, Bearish Three Black Crows, Bearish
Three Inside Down, Bearish Thrusting, Bullish Abandoned Baby, Bullish Doji,
Bullish Doji Star, Bullish Gravestone Doji, Bullish Harami, Bullish Homing
Pigeon, Bullish Ladder Bottom, Bullish Long White Real Body, Bullish Matching
Low, Bullish Meeting Lines, Bullish Piercing Line, Bullish Three Inside Up.
|
 |
|
The following are the predefined Candlestick Screener criteria:
|
|
|
|
|
|