| Home > Technical Analysis Tutorial > Candlestick Patterns
|
Bullish Dragonfly Doji
How to identify a Bullish Dragonfly Doji Candlestick Pattern
|
A Bullish Dragonfly Doji Pattern is one candle pattern that appears in a downtrend.
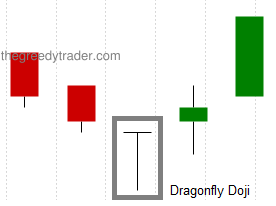
- The open, high, and close prices are equal or very close to each other.
- The candle has a long lower shadow.
|
Bullish Dragonfly Doji Candlestick Pattern Reliability
|
A Dragonfly Doji candlestick pattern is usually considered as a reversal candlestick pattern that appears in both uptrend and downtrend. According to our research, a Dragonfly Doji pattern appears more often in a downtrend and has an above average Gain/Loss ratio.
|
Daily Patterns |
Weekly Patterns |
| Frequency |
Above Average |
Low |
| Reversal in downtrend |
26% |
47% |
| Reversal in downtrend when parent trend is up |
39% |
90% |
| Reversal in downtrend when parent trend is down |
22% |
29% |
| Avg. Gain/Loss Ratio in Downtrend |
1.88 |
4.28 |
|
Market Sentiment
|
A long lower shadow indicates that a market sentiment sharply changed. A Dragonfly Doji pattern appears when a price moves significantly lower, but it can not hold. The low price attracts more buyers, and a market sentiment changes sharply from bearish to bullish.
|
Bullish Dragonfly Doji Trading Tips and Techniques
|
Usually bullish Dragonfly Doji traders wait for the next day bullish candle as a confirmation of the trend reversal before opening a new position. According to our research, a bullish next candle that closes above the Dragonfly Doji closing price increases the reliability of the reversal and increases the Gain/Loss Ratio for daily and weekly patterns. The next day gap up increases a pattern reliability and profitability, and it can be used as a reversal confirmation as well.
The following factors can improve a pattern reliability and profitability:
- Oversold momentum technical indicators.
- A price closer to the Lower Bollinger Band.
- A price is below 20, 50, and 100 Day Moving Averages.
- A bearish candle preceding a Dragonfly Doji for both daily and weekly patterns. The bigger is a real body of the preceding bearish candle the greater is the effect.
- A Doji candle gap down from the pervious candle close price.
- A longer Doji candle shadow.
|
Bullish Dragonfly Doji Examples
|
|
Example #1: Daily downtrend reversal signal
The following image shows a chart of The Williams Companies, Inc. (WMB) that formed a daily Bullish Dragonfly Doji pattern on May 16th, 2005 as a daily downtrend reversal signal.
| WMB: The Williams Companies, Inc.
|
|
|
|
The Candlestick/SAR technique generates the following trading signals:
May 16th, 2005:
- Buy on market open at $16.25.
- Set stop-loss at $15.62 (the pattern low).
|
June 21st, 2005:
- Sell at $19.15.
- Gain: 17.85% in 25 business days.
|
Example #3: Weekly downtrend reversal signal.
The following image shows a weekly Bullish Dragonfly Doji pattern that formed between May 3 and May 14, 2021 on a chart of Synopsys, Inc. (SNPS). The pattern signaled a weekly downtrend reversal and a beginning of a new weekly rising trend.
The Candlestick/SAR technique generated the following trading signals:
May 17, 2021:
- Buy on market open at $236.5.
- Set stop-loss at $225.02 (the pattern low).
|
September 22, 2021:
- Sell at $315.267.
- Gain: 33.3% in 90 business days.
|
|


|