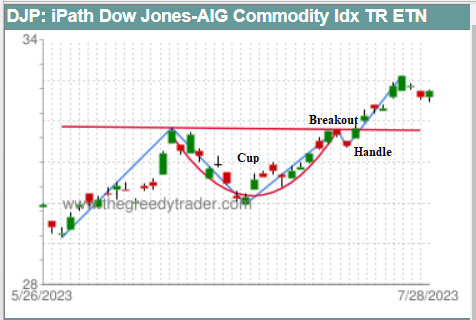
A cup and handle is a common bullish chart pattern that resembles a “cup” with a “handle”. It is a continuation pattern that occurs after a rising trend and indicates a consolidation period followed by a breakout. A cup usually has a “U” shape with the highs on both sides at approximately the same level. A handle forms after the cup as a temporary pullback or final consolidation. It may look like a flag or pennant before the breakout. A cup and handle pattern may appear in different time frames. The distance between the right peak of the cup and the bottom is usually considered as a projected price rise from the breakout.
Our
Chart Patterns Screener allows users to see a list of stocks that formed an Cup and Handle chart pattern in daily, weekly, monthly, quarterly and yearly time frames. The presence of the Cup and Handle pattern in the stock’s price time frame is indicated by the following icons:

- Cup and Handle Pattern

- Confirmed Cup and Handle Pattern

- Cup and Handle Pattern with price near the breakout