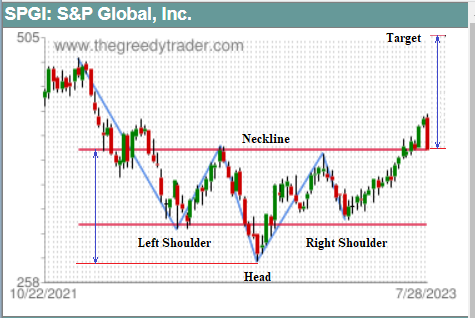
An Inverse Head and Shoulders is a common chart pattern that indicates a bullish reversal. The pattern looks like a standard Head and Shoulders pattern flipped upside-down. The pattern consists of three low points on the price chart. The first (left) and the third (right) points are at a similar level, while the second (middle) point is the lowest in the pattern. The two highs that occur between the three lows are also at a similar level. The line that connects these two highs is called the neckline. The Inverse Head and Shoulders pattern signals the end of a downtrend and the start of a new uptrend. A price move above the neckline is often seen as a confirmation of the pattern and a buy signal. The price difference between the head and the neckline can be used to estimate the target price after the breakout.
Our
Chart Patterns Screener allows users to see a list of stocks that formed an Inverse Head and Shoulders chart pattern in daily, weekly, monthly, quarterly and yearly time frames. The presence of the Inverse Head and Shoulders pattern in the stock’s price time frame is indicated by the following icons:

- Inverse Head and Shoulders Pattern

- Confirmed Inverse Head and Shoulders Pattern

- Inverse Head and Shoulders Pattern with price near the neckline

- Invalidated Inverse Head and Inverse Shoulders Pattern