| Home > Technical Analysis Tutorial > Candlestick Patterns
|
Bullish Homing Pigeon
How to identify a Bullish Homing Pigeon Candlestick Pattern
|
A Bullish Homing Pigeon is a common two-day candlestick pattern that often appears in a downtrend.
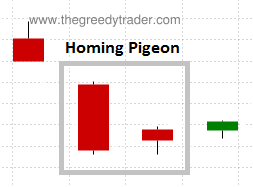
- Consists of two candles.
- The first candle is a bearish candle with a long real body.
- The second candle is a bearish candle.
- The second candle open price is below the first candle open price.
- The second candle close price is above the first candle close price.
|
Bullish Homing Pigeon Candlestick Pattern Reliability
|
A Bullish Homing Pigeon is usually considered a downtrend reversal pattern with an average reliability. Bullish Homing Pigeon is a popular trading pattern among the candlestick traders. Even considering that pattern's reversal reliability is not high, it has an above average profitability, since its two bearish candles in falling trend usually allow buying stock at close to the bottom price.
According to our research, the Homing Pigeon candlestick pattern is a continuation signal with an above average reliability when appears in a rising trend.
|
Daily Patterns |
Weekly Patterns |
| Frequency |
High |
Above Average |
| Appears in downtrend |
69% |
79% |
| Reversal in downtrend |
26% |
39% |
| Reversal in downtrend when parent trend is up |
64% |
84% |
| Reversal in downtrend when parent trend is down |
17% |
18% |
| Continuation in uptrend |
55% |
24% |
| Continuation in uptrend when parent trend is up |
81% |
56% |
| Continuation in uptrend when parent trend is down |
15% |
6% |
| Avg. Gain/Loss Ratio in Downtrend |
1.57 |
2.99 |
| Avg. Gain/Loss Ratio in Uptrend |
2.33 |
2.92 |
|
Market Sentiment
|
After a long bearish first day, a positive gap on a second day shows that buyers returning to the market and sentiments are changing to the bullish. The buyers are not strong enough yet to keep price up, but bearish sentiments are already weakening, and sellers are not able to close the second day as low as the previous day. That market behavior signals a potential trend reversal.
|
Bullish Homing Pigeon Trading Tips and Techniques
|
Our research shows that using Homing Pigeon pattern with momentum technical indicators does not really improve the signal reliability or profitability. Usually traders consider the next day gap up or bullish candle as an important confirmation of the reversal. Our research shows that the next day bullish candle confirmation increases the reliability of a downtrend reversal by more then 113%, but it decreases the trade Gain/Loss Ratio more than 11%, since traders are reducing the potential gains and increasing potential losses by waiting too long and buying stack at a higher price. The next day gap up increases a probability of a reversal by almost 64%, but it appears that trades without the next day price gap up have 5% higher Gain/Loss Ratio.
|
Bullish Homing Pigeon Examples
|
|
Example #1: Daily downtrend reversal signal
The above price chart of State Street Corp. (STT) shows a daily bullish Homing Pigeon candlestick pattern that formed on March 27 - 28, 2016 signaling the reversal of the falling trend. The new rising trend started on March 27 at $50.6.
The Candlestick/SAR technique generates the following trading signals:
March 29, 2016:
- Buy on market open at $51.73.
- Set stop-loss at $50.6 (the pattern low).
|
August 25, 2016:
- Sell at $68.85.
- Gain: 31.1% in 105 business days.
|
Example #2: Daily uptrend continuation signal.
A price chart of SL Green Realty Corp. (SLG) below shows a daily rising trend from April 1st, 2009 till May 8th, 2009. A bullish Homing Pigeon candlestick pattern was formed during a short trend retreat on April 7 - 8, 2009 as a daily uptrend continuation signal.
| SLG: SL Green Realty Corp.
|
|
|
|
The Candlestick/SAR technique generates the following trading signals:
April 9, 2009:
- Buy on market open at $11.85..
- Set stop-loss at $9.97, derived as the pattern low ($10.56) plus the close price ($10.87) minus the last candle high ($11.46).
|
May 13, 2009:
- Sell at $22.42.
- Gain: 89.2% in 24 business days.
|
Example #3: Weekly downtrend reversal signal.
The following image shows a weekly downtrend reversal Homing Pigeon pattern that was formed on a Huntington Bancshares Incorporated (HBAN) price chart between June 24 and July 7, 2016. The pattern marked the end of a weekly downtrend and a beginning of a new rising weekly trend.
| HBAN: Huntington Bancshares Inc.
|
|
|
|
The Candlestick/SAR technique generated the following trading signals:
July 5, 2016:
- Buy on market open at $8.71.
- Set stop-loss at $8.05 (the pattern low).
|
January 18, 2017:
- Sell at $12.92.
- Gain: 48.34% in 137 business days.
|
Example #4: Weekly uptrend continuation signal.
| JJG: iPath Dow Jones AIG-Grains ETN
|
|
|
|
An image above shows a weekly rising trend on a price chart of the iPath Dow Jones AIG-Grains ETN (JJG). The trend started on July 7, 2020 and continued until November 24, 2020. A weekly bullish Homing Pigeon candlestick pattern was formed by two weekly candles between September 21 and October 2, 2020. The Homing Pigeon pattern was a continuation signal that formed during a short price retreat in a weekly uptrend.
The Candlestick/SAR technique generated the following trading signals:
October 6, 2020:
- Buy on market open at $45.17.
- Set stop-loss at $42.93 (the pattern low).
|
March 2, 2021:
- Sell at $58.5.
- Gain: 29.51% in 101 business days.
|
|


|