| Home > Technical Analysis Tutorial > Candlestick Patterns
|
Bullish Meeting Lines
How to identify a Bullish Meeting Lines Candlestick Pattern
|
A Bullish Meeting Lines is a common two-day candlestick pattern that often appears in a downtrend as a reversal signal with an above average reliability and profitability.
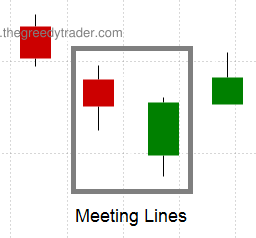
- Consists of two candles.
- The first candle is bearish and has an average or above average real body
- The second candle is bullish with an average or above average real body as well.
- The second candle opens lower than the close of the first candle.
- The second candle closes at previous day's closing level.
|
Bullish Meeting Lines Candlestick Pattern Reliability
|
Bullish Meeting Lines is a reliable two candles reversal pattern that appears mostly in a downtrend. The pattern's reversal signal has an above average reliability and in a downtrend it has above an average Gain/Loss ratio.
|
Daily Patterns |
Weekly Patterns |
| Frequency |
High |
High |
| Appears in downtrend |
63% |
76% |
| Reversal in downtrend |
36% |
53% |
| Reversal in downtrend when parent trend is up |
71% |
92% |
| Reversal in downtrend when parent trend is down |
27% |
25% |
| Continuation in uptrend |
61% |
37% |
| Continuation in uptrend when parent trend is up |
86% |
68% |
| Continuation in uptrend when parent trend is down |
14% |
8% |
| Avg. Gain/Loss Ratio in Downtrend |
3.23 |
2.20 |
| Avg. Gain/Loss Ratio in Uptrend |
2.16 |
1.57 |
|
Bullish Meeting Lines Trading Tips and Techniques
|
Our research shows filtering Meeting Lines patterns with Daily Lane's Stochastic (%D-Slow) less than 45% improves Gain/Loss ratio by more than 30%. Other momentum technical indicators do not have significant correlation with the Meeting Lines pattern reliability and profitability. The next day market open gap up improves the pattern reliability by almost 35%, but decreases the Gain/Loss ratio by more than 60%.
|
Bullish Meeting Lines Examples
|
|
Example #1: Daily downtrend reversal signal.
The following image shows a chart of Baker Hughes Company (BKR) where Bullish Meeting Lines candlestick pattern formed on April 20 - 21, 2021.
| BKR: Baker Hughes Company
|
|
|
|
The Candlestick/SAR technique generates the following trading signals:
April 22nd, 2021:
- Buy on market open at $19.53.
- Set stop-loss at $18.75 (the pattern low).
|
May 19th, 2021:
- Sell at $24.82.
- Gain: 27.1% in 19 business days.
|
Example #2: Daily uptrend continuation signal.
A chart of EOG Resources, Inc. (EOG) above shows a daily Bullish Meeting Lines candlestick pattern that was formed on September 8 and September 9, 2021. The pattern appears during a daily rising trend as an uptrend continuation signal after a temporary price retreat.
The Candlestick/SAR technique generates the following trading signals:
September 10, 2021:
- Buy on market open at $68.49.
- Set stop-loss at $66.08 (the pattern low).
|
October 13, 2021:
- Sell at $88.41.
- Gain: 24.08% in 24 business days.
|
Example #3: Weekly downtrend reversal signal.
A following chart of Macy's, Inc. (M) shows a weekly Bullish Meeting Lines candlestick pattern that formed between September 21 and October 2, 2020. The pattern signaled a weekly downtrend reversal and a beginning of a new rising weekly trend.
The Candlestick/SAR technique generated the following trading signals:
September 5, 2020:
- Buy on market open at $6.07.
- Set stop-loss at $5.57 (the pattern low).
|
February 18, 2021:
- Sell at $14.26.
- Gain: 134.93% in 94 business days.
|
Example #4: Weekly uptrend continuation signal.
The image above shows a weekly Bullish Meeting Lines candlestick pattern that was formed on a price chart of ViaCell, Inc. (VIAC) between April 13 and April 24, 2020. The pattern appeared as a continuation signal during a weekly rising trend that started on April 3, 2022.
The Candlestick/SAR technique generated the following trading signals:
April 27, 2020:
- Buy on market open at $15.72.
- Set stop-loss at $14.39 (the pattern low).
|
October 12, 2020:
- Sell at $28.57.
- Gain: 81.74% in 106 business days.
|
|


|