| Home > Technical Analysis Tutorial > Candlestick Patterns
|
Bullish Three Inside Up Pattern
How to identify a Bullish Three Inside Up Candlestick Pattern
|
A Bullish Three Inside Up is a rare candlestick pattern that consists of three candles and more often appears in a downtrend.
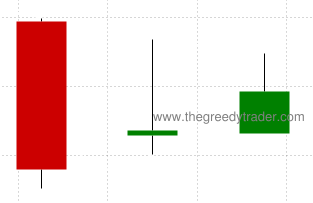
- The first is a large bearish candle (Long Red Real Body).
- The second is a smaller candle contained within the first candle.
- The first two candles actually are forming a bullish Harami pattern.
- The third is a bullish candle that closes above the closing price of a second candle.
|
Bullish Three Inside Up Candlestick Pattern Reliability
|
The first two candles of a bullish Three Inside Up candlestick pattern are a bullish Harami pattern. The third bullish candle serves as a pattern confirmation and improves the pattern's reliability. The downtrend reversal reliability for a daily Harami pattern is 40%, while the Three Inside Up pattern reliability is 56%. For weekly patterns, the difference is even higher (Harami - 56%, Three Inside Up - 91%). On the other hand, an additional bullish day increases a trade entry price and decreases a potential gain while increasing the potential loss. For this reason the daily Gain/Loss Ratios are lower for the Three Inside Up pattern.
|
Daily Patterns |
Weekly Patterns |
| Frequency |
Very Low |
Above Average |
| Appears in downtrend |
68% |
79% |
| Reversal in downtrend |
56% |
91% |
| Reversal in downtrend when parent trend is up |
99% |
99% |
| Reversal in downtrend when parent trend is down |
20% |
67% |
| Continuation in uptrend |
85% |
62% |
| Continuation in uptrend when parent trend is up |
92% |
81% |
| Continuation in uptrend when parent trend is down |
1% |
4% |
| Avg. Gain/Loss Ratio in Downtrend |
0.64 |
2.70 |
| Avg. Gain/Loss Ratio in Uptrend |
1.94 |
1.52 |
|
Bullish Three Inside Up Trading Tips and Techniques
|
A Three Inside Up pattern presents much more reliable and profitable signal, if the pattern following the candle provides a reversal confirmation. The next day opening price gap down can be considered as a confirmation. It significantly improves the reversal signal reliability as well as a Gail/Loss ratio. The pattern following candle closing price above the pattern closing price can be used as another highly reliable reversal confirmation signal.
|
Bullish Three Inside Up Examples
|
|
Example #1: Daily downtrend reversal signal.
The following price chart of Alliant Energy Corp. (LNT) shows a daily Bullish Three Inside Up candlestick pattern that was formed between November 30 and December 2, 2021. The following candle opened with a gap up and a closing price above the pattern's closing price.
| LNT: Alliant Energy Corp.
|
|
|
|
For the first bullish Three Inside Up pattern, a Candlestick/SAR technique generates the following trading signals:
December 3, 2021:
- Buy on market open at $56.31.
- Set stop-loss at $54.53 (the pattern low).
|
January 3, 2022:
- Sell at $35.55.
- Gain: 7.21% in 21 business days.
|
Example #2: Daily uptrend continuation signal.
The Quest Diagnostics (DGX) chart above shows a rising daily price trend from November 11 to December 31, 2021. A daily Bullish Three Inside Up candlestick pattern was formed between November 30 and December 3, 2021. The pattern marked a short term price consolidation period, and it was a rising trend continuation signal.
The Candlestick/SAR technique generated the following trading signals:
December 3, 2021:
- Buy on market open at $154.8.
- Set stop-loss at $148.36 (the pattern low).
|
December 21, 2021:
- Sell at $167.54.
- Gain: 8.23% in 12 business days.
|
Example #3: Weekly downtrend reversal signal.
A weekly Bullish Three Inside Up candlestick pattern below was formed between September 18 and October 9, 2020 on a Nordstrom (JWN) price chart. The pattern appeared at the end of a weekly downtrend as a reversal signal, and it marked a beginning of a new weekly rising trend.
The Candlestick/SAR technique generated the following trading signals:
October 12, 2020:
- Buy on market open at $13.86.
- Set stop-loss at $11.72 (the pattern low).
|
March 3, 2021:
- Sell at $35.67.
- Gain: 157.36% in 98 business days.
|
Example #4: Weekly uptrend continuation signal.
The E*Trade (ETFC) chart above shows an example of a weekly Bullish Three Inside Up chart pattern continuation signal. The pattern was formed between April 11 and April 25, 2003 during a weekly uptrend that started on March 12, 2003. The pattern indicated a short term price consolidation period and presented a weekly uptrend continuation signal.
The Candlestick/SAR technique generated the following trading signals:
April 28, 2003:
- Buy on market open at $50.5.
- Set stop-loss at $41.5 (the pattern low).
|
August 1, 2003:
- Sell at $90.46.
- Gain: 79.13% in 67 business days.
|
|


|