| Home > Technical Analysis Tutorial > Technical Indicators
|
Technical Indicators and Signals
TheGreedyTrader Technical Tools
|
TheGreedyTrader.com's technical analysis tools provide a variety of technical indicators and trading signals. Most of them are available in daily and weekly time frames, and include scanning functionality that allows users to find a list of stocks that match selected technical criteria. They can be divided into two major categories. The first category of tools presents stock screening results with predefined technical criteria. The second category of tools gives users the ability to build their own advanced technical criteria to find a list of stocks that match their personal trading preferences.
Predefined Technical Stock Screener
The Predefined Technical Stock Screener includes several different screens divided by categories:
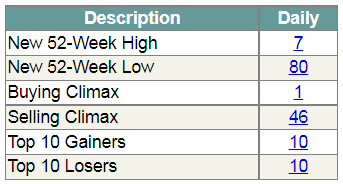 |
Weekly Gainers/Losers
This screen presents lists of stocks that made the new 52 week high and low, buying and selling climax, and top 10 gainers and losers. |
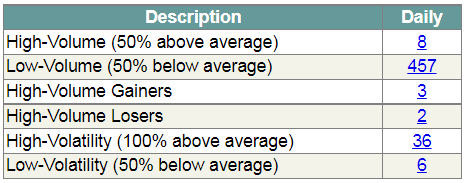 |
High/Low Volume-Volatility
This screen presents lists of weekly high and low volume stocks, high volume gainers and losers, and high and low volatility stocks. |
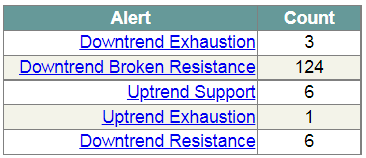 |
Advanced Technical Alerts
This screen presents eight technical stock alerts generated weekly by our system as stock market technical warning signals. You can find more information about our stock alerts at the
What are stock alerts? page. |
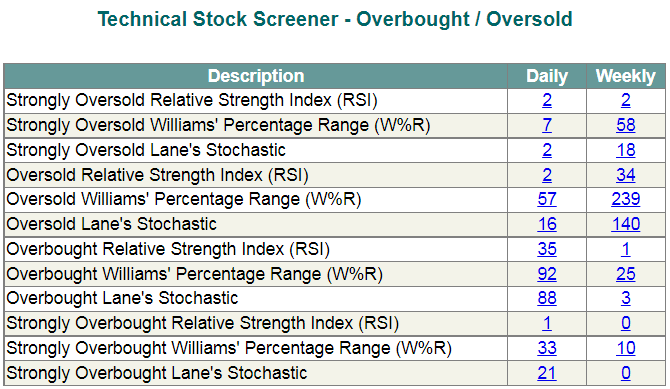 |
Overbought / Oversold
This screen presents lists of stocks with daily and weekly oversold, strongly oversold, overbought, and strongly overbought Relative Strength Index (RSI), Williams' Percentage Range (W%R), and Lane's Stochastic. |
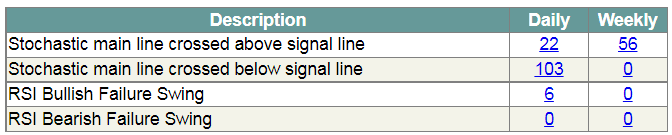 |
Oscillators Signals
This screen presents lists of stocks whose Lane's Stochastic main line has crossed the signal line, as well as lists of stocks with an RSI Bullish or Bearish Failure Swing. |
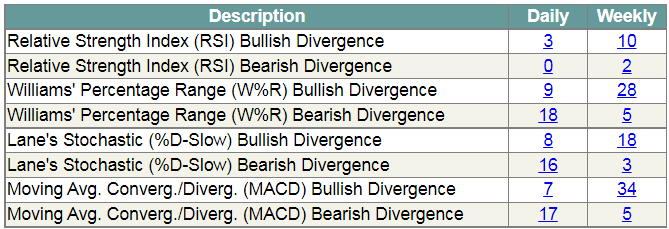 |
Bullish / Bearish Divergence
This screen presents lists of stocks with bullish or bearish divergence in the Relative Strength Index (RSI), Williams' Percentage Range (W%R), Lane's Stochastic, and Moving Average Convergence Divergence (MACD) in daily and weekly time frames. |
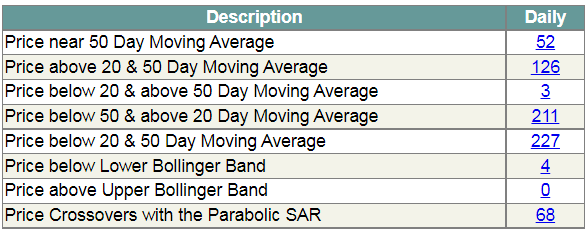 |
Trend Following indicators
Technicians often plot technical indicators on the price charts along with the stock price to watch if they come closer or cross over.
The Trend Following Indicators screen shows lists of stocks where the stock price crosses over the Parabolic SAR, or near, above, or below the 20 & 50 Day Moving Averages and Bollinger Bands. |
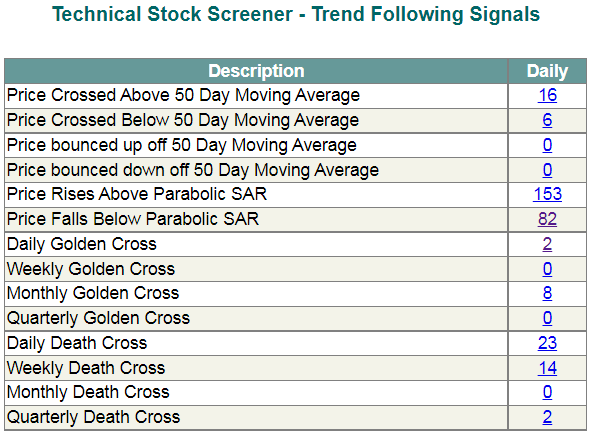 |
Trend Following Signals
This screen shows lists of stocks where the price crossed or bounced off the 50 Day Moving Average, or crossed above or below the Parabolic SAR. It also displays the daily, weekly, monthly, and quarterly Golden Cross and Death Cross signals. |
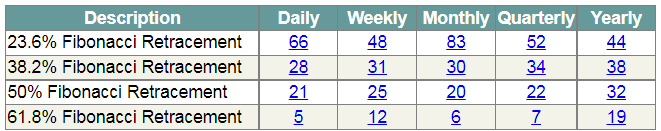 |
Fibonacci Retracement
This screen shows lists of stocks that have prices near the 38.2%, 50%, or 61.8% Fibonacci Retracement level in daily, weekly, monthly, quarterly, and yearly time frames |
Each of the above predefined technical searches shows the number of stocks that match the criteria. If the user clicks on the number, the next screen will show the complete list of corresponding stocks with detailed technical information.
Advanced Technical Screener
The Advanced Technical Screener allows the user to build his own technical criteria by combining several different indicators, signals, chart patterns, and trend analyses.
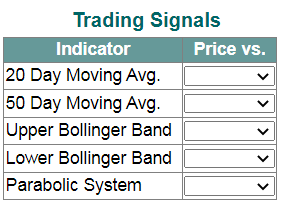
The Trading Signals section of the Advanced Technical Screener is located on the left upper corner of the screen. It allows users to search for stocks with prices above, below, or crossing over the 20 & 50 Day Moving Average, Bollinger Bands, or Parabolic SAR.
|
|
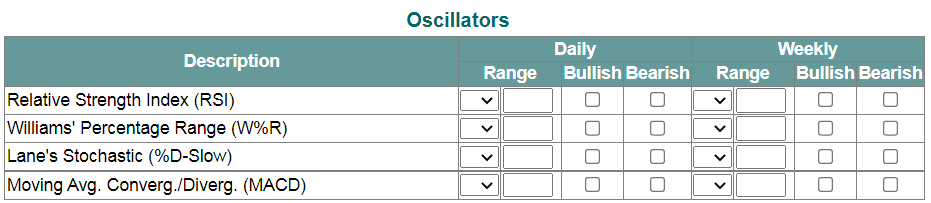
The Oscillators section is located just below the Trading Signals section. It allows users to specify the range for the daily and weekly Relative Strength Index (RSI), Williams' Percentage Range (W%R), Lane's Stochastic, and Moving Average Convergence Divergence (MACD), as well as bullish or bearish divergence for these indicators.
|
|
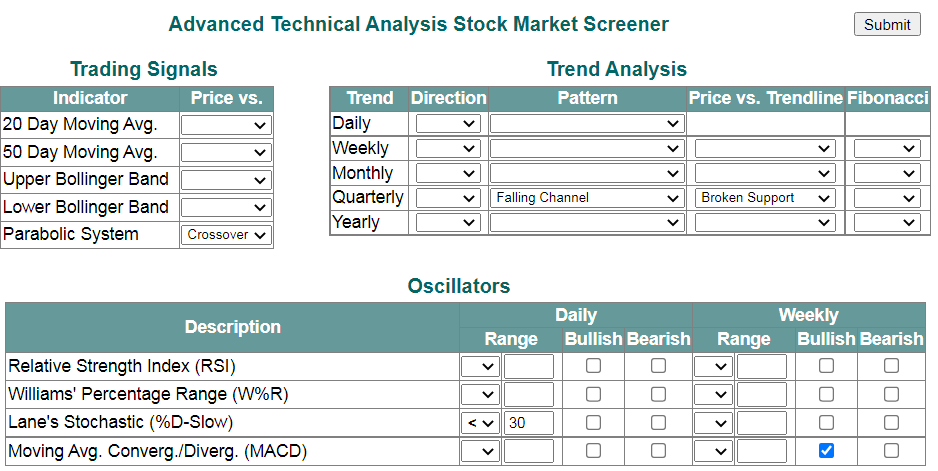
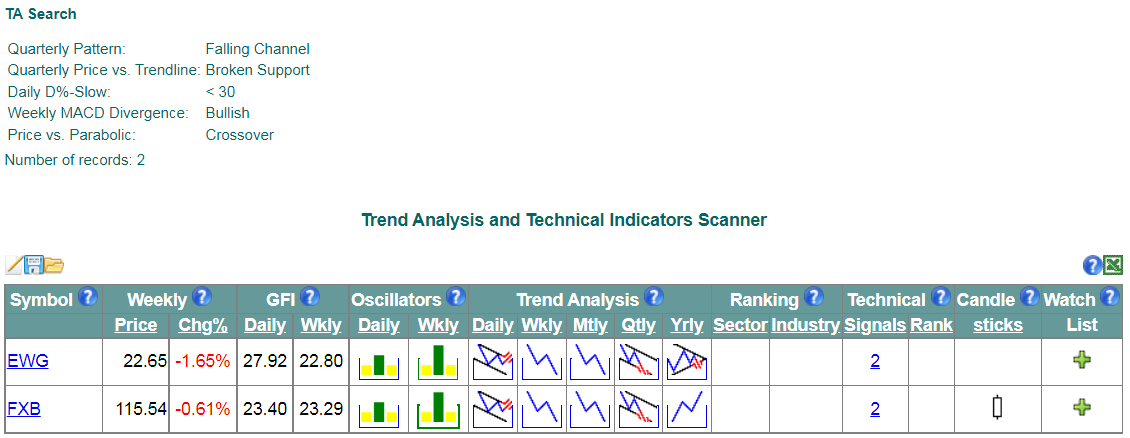
User can combine the above criteria with trend direction and chart pattern criteria using the Trend Analysis section, which is located on the right top corner of the screen. For example, let's select the following search criteria as shown on the picture below:
- Quarterly Pattern: Falling Channel
- Quarterly Price vs. Trendline: Broken Support
- Daily Lane's Stochastic (D%-Slow): < 30
- Weekly MACD Divergence: Bullish
- Price vs. Parabolic: Crossover
|
|
After selecting the above criteria, the user can press the Submit button located on the right upper corner to see the search results on the Trend Analysis and Technical Indicators screen. The image below shows the search results for the criteria selected on the Advance Technical Screener images described previously. All selected criteria are listed on the top left corner of the screen under the "TA Search" title. The grid below shows a list of stocks that match the selected criteria.
|
|
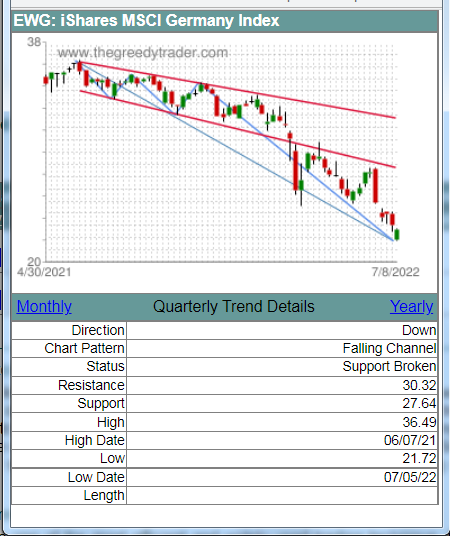
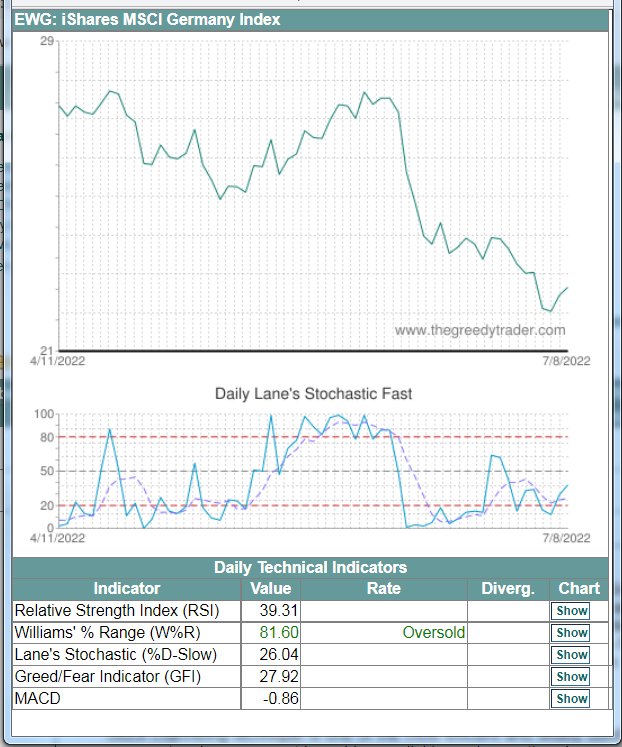
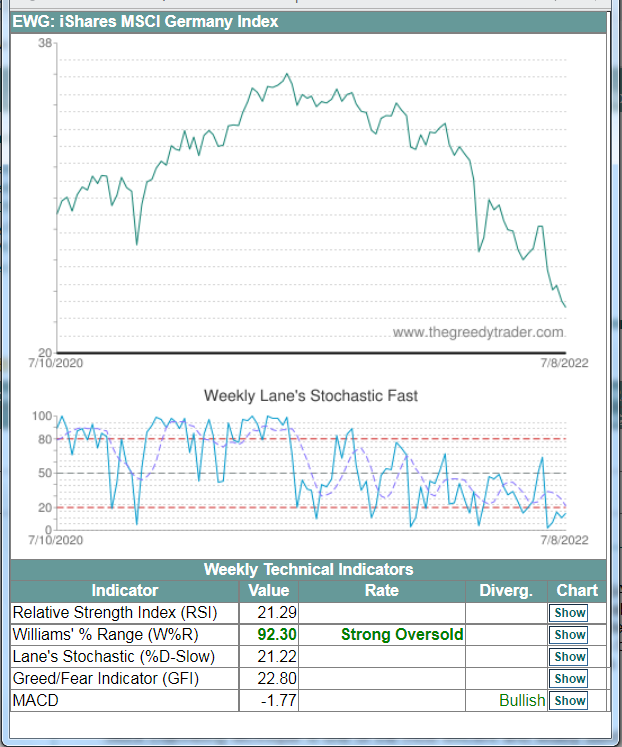
Users can click on icons in Oscillators columns to see the price chart with daily or weekly technical indicators, or click on Trend Analysis icons to see daily, weekly, monthly, quarterly, or yearly charts patterns (see images below).
| EWG Quarterly Chart Pattern |
EWG Daily Oscillators |
EWG Weekly Oscillators |
 |
 |
 |
You can click here to find more information on how to use the Stock Screener, or click here to find more information on how to use the Trend Analysis and Technical Indicators screen.
|


|