| Home > Technical Analysis Tutorial > Candlestick Patterns
|
Bullish Breakaway Pattern
How to identify a Bullish Breakaway Candlestick Pattern
|
A bullish Breakaway candlestick pattern consists of five candles.
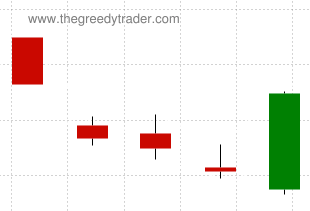
- The first candle is a long bearish candle.
- The second candle is a bearish candle with a negative opening gap.
- The next two candles closing price should be lower than the previous candles' closing prices. It is not necessary that both of them are bearish, and it is not required that the low shadow is lower than the previous candles' lows.
- The fifth candle should have a long green real body, and it should close between the closing price of the first candle and the opening price of the second candle.
|
Bullish Breakaway Candlestick Pattern Reliability
|
Bullish Breakaway Candlestick Pattern is not very common, but pretty reliable candlestick downtrend reversal pattern. According to our research, a daily pattern predicts a bullish reversal in a downtrend with an accuracy of 79%.
Some traders don't start a trade until they see a reversal confirmation. Reversal is confirmed when the closing price of the candle following the pattern is higher than the closing price of the pattern. According to our data, the Bullish Breakaway Candlestick reversal confirmation makes the pattern reversal signal significantly more reliable and increases the Gain/Loss ratio.
|
Daily Patterns |
Weekly Patterns |
| Frequency |
Very Low |
Low |
| Appears in downtrend |
86% |
99% |
| Reversal in downtrend |
79% |
99% |
| Reversal in downtrend when parent trend is up |
99% |
99% |
| Reversal in downtrend when parent trend is down |
54% |
99% |
| Continuation in uptrend |
30% |
N/A |
| Continuation in uptrend when parent trend is up |
99% |
N/A |
| Continuation in uptrend when parent trend is down |
13% |
N/A |
| Avg. Gain/Loss Ratio in Downtrend |
1.92 |
2.50 |
| Avg. Gain/Loss Ratio in Uptrend |
0.12 |
N/A |
|
Market Sentiment
|
What bullish Breakaway pattern can tell us about prevailing market emotions? The first long bearish candle and the following negative opening gap indicate strong negative bearish market sentiments, but three smaller negative candles signal that sellers are losing strength. The fifth strong bullish candlestick that close above real bodies of all three previous candles signals strong changes in market sentiment, and there is high probability that bullish behavior will prevail.
|
Bullish Breakaway Examples
|
|
Example #1: Daily downtrend reversal signal.
An example below presents the chart of the Health Care Select Sector SPDR Fund (XLV). The daily bullish Breakaway pattern was formed between July 18th and July 24th, 2002. The price was in a daily downward wave below 20 day moving average with strongly oversold Lane's Stochastic. The fifth candlestick on July 24th marked the trend reversal point and the start of a new uptrend that lasted 21 business days from 21.65 on July 24th to 28.62 on August 22rd and made 32.19% gain.
| XLV: Health Care Select Sector SPDR Fund
|
|
|
|
For the first bullish Breakaway pattern, a Candlestick/SAR technique generates the following trading signals:
July 25, 2002:
- Buy on market open at $23.6.
- Set stop-loss at $23.5 (the pattern low).
|
August 27, 2002:
- Sell at $27.7.
- Gain: 17.37% in 23 business days.
|
Example #2: Daily uptrend continuation signal.
The following image shows a daily Bullish Breakaway pattern formed on a chart of ONEOK Inc. (OKE) between May 16 and May 22, 2000. The OKE price was in a daily rising trend that started on May 1st. The pattern presented a daily uptrend continuation signal after a temporary price retreat.
The Candlestick/SAR technique generated the following trading signals:
May 23, 2000:
- Buy on market open at $6.7025.
- Set stop-loss at $6.4525 (the pattern low).
|
June 8, 2000:
- Sell at $6.993.
- Gain: 4.33% in 11 business days.
|
Example #3: Weekly downtrend reversal signal.
| FXI: iShares FTSE/Xinhua China 25 Index.
|
|
|
|
The chart of iShares FTSE/Xinhua China 25 Index (FXI) above shows a weekly Bullish Breakaway candlestick pattern that was formed between February 9 and March 13, 2009. The pattern signaled a weekly falling trend reversal and a beginning of a new weekly rising trend.
The Candlestick/SAR technique generated the following trading signals:
March 16, 2009:
- Buy on market open at $27.24.
- Set stop-loss at $22.69 (the pattern low).
|
August 18, 2009:
- Sell at $39.57.
- Gain: 45.26% in 109 business days.
|
|


|