| Home > Technical Analysis Tutorial > Candlestick Patterns
|
Matching Low Pattern
How to identify a Bullish Matching Low Candlestick Pattern
|
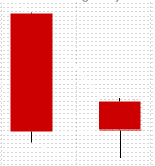 The bullish Matching Low candlestick pattern consists of two bearish candles and usually appears in a downtrend.
- The pattern consists of two bearish candles.
- Both candles have similar or identical closing prices.
|
Bullish Matching Low Pattern Reliability
|
Usually, the Matching Low pattern is considered a downtrend reversal signal. According to our research, a daily Matching Low pattern acts as continuation pattern 78% of the time in daily downtrends, and a weekly pattern is a continuation signal in 64% of weekly downtrends. In daily uptrends, the Matching Low pattern usually represents a price consolidation period and signals possible continuation of the upward movement. Chances of the uptrend continuation are substantially higher when the parent's trend is up.
The Daily Matching Low candlestick pattern presents one of the highest historical average Gain/Loss ratios of 3.2 and usually provides a highly profitable trading opportunity. The Weekly Matching Low pattern has quite high Gain/Loss ratios as a reversal signal in weekly downtrends, and as a continuation signal in weekly uptrends. In both cases, signals are substantially more reliable when the parent trend is up.
|
Daily Patterns |
Weekly Patterns |
| Frequency |
Above Average |
Above Average |
| Appears in downtrend |
72% |
77% |
| Reversal in downtrend |
22% |
36% |
| Reversal in downtrend when parent trend is up |
50% |
87% |
| Reversal in downtrend when parent trend is down |
15% |
18% |
| Continuation in uptrend |
48% |
22% |
| Continuation in uptrend when parent trend is up |
92% |
64% |
| Continuation in uptrend when parent trend is down |
12% |
3% |
| Avg. Gain/Loss Ratio in Downtrend |
1.3 |
2.6 |
| Avg. Gain/Loss Ratio in Uptrend |
3.2 |
2.8 |
|
Market Sentiment
|
|
During downtrends after a bearish day, market sentiments are bearish and sellers are moving the price even lower, but the new low does not hold, and by the end of the day, buyers push the price back to the previous day's close. The longer second candle's lower shadow indicates the stronger changes to the bullish market sentiments.
|
Bullish Matching Low Trading Tips and Techniques
|
The bullish Matching Low candlestick pattern signal is more reliable when the second candle has a long lower shadow (longer than its real body) or at least lower than the low of the first candle. The reliability is higher if the second candle is a Hammer.
Oversold momentum technical indicators don't improve the signal's reliability, but the uptrend continuation signals become significantly more profitable with much higher Gain/Loss ratios.
Waiting for the next candle to confirm the price direction may increase the signal reliability, but actually decreases the trade profitability.
|
Bullish Piercing Line Examples
|
|
Example #1: Daily downtrend reversal signal
| ISRG: Intuitive Surgical Inc.
|
|
|
|
The above price chart of Intuitive Surgical Inc. (ISRG) presents a bullish Matching Low candlestick pattern reversal signal. The Matching Low pattern was formed on June 24 - 25, 2020. The pattern's second candle was a Hammer. The price was below the Parabolic SAR and near the Lower Bollinger Band.
The Candlestick/SAR technique generates the following trading signals:
June 26, 2020:
- Buy on market open at $556.57.
- Set stop-loss at $543.03 (the pattern low).
|
August 6, 2020:
- Sell at $684.99.
- Gain: 23.07% in 28 business days.
|
Example #2: Daily uptrend continuation signal.
The following shows a bullish daily Matching Low candlestick pattern formed on the EOG Resources (EOG) daily chart in the daily rising trend. The daily uptrend started on June 13, 2006. The Matching Low pattern formed on June 19 - 20, 2006 as a continuation signal.
The Candlestick/SAR technique generates the following trading signals:
June 21, 2006:
- Buy on market open at $29.595.
- Set stop-loss at $29.225 (the pattern low).
|
July 14, 2006:
- Sell at $34.515
- Gain: 16.6% in 16 business days.
|
Example #3: Weekly downtrend reversal signal.
The following example shows the weekly downtrend reversal Matching Low pattern on the weekly candlestick chart of the Kimco Realty Corp (KIM). The pattern was formed by two weekly candles (Week #1: Oct.26 - Oct.30, 2020 and Week #2: Nov. 2 - Nov 6, 2020) and signaled the reversal of the weekly downtrend that started on Sept. 15, 2020 and ended on Nov.29, 2020. The price was below the weekly Parabolic SAR and below the 20 and 40 week Moving Average.
The weekly Candlestick/SAR technique generates the following trading signals:
November 13, 2020:
- Buy on market open at $11.74.
- Set stop-loss at $9.19, derived as the pattern low ($10.04) plus the close price ($10.26) minus the last candle high ($11.11).
|
May 19, 2020:
- Sell at $20.42.
- Gain: 73.94% in 127 business days.
|
Example #4: Weekly uptrend continuation signal.
The following example shows a weekly Matching Low pattern appearing in a rising trend as a trend continuation signal.
| CHTR: harter Communications
|
|
|
|
The Matching Low pattern on a candlestick chart of the Charter Communications (CHTR) above was formed by two weekly candles (Week #1 July 25 - 29, 2016 Week #2 August 1 - 5, 2016) on a weekly uptrend that started on June 27, 2016 and ended on September 6, 2016. The Matching Low pattern presented a two weeks consolidation period and sent the rising trend continuation signal.
The weekly Candlestick/SAR technique generates the following trading signals:
August 8, 2016:
- Buy on market open at $234.55.
- Set stop-loss at $229.99, derived as the pattern low ($234.16) plus the close price ($234.79) minus the last candle high ($238.96).
|
October 11, 2016:
- Sell at $262.32.
- Gain: 11.84% in 45 business days.
|
|


|