| Home > Technical Analysis Tutorial > Candlestick Patterns
|
Bullish Harami Pattern
How to identify a Bullish Harami Candlestick Pattern
|
A bullish Harami is a very common two-day candlestick pattern that appears usually in a downtrend.
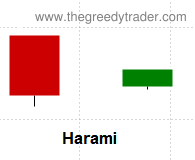
- A pattern consists of two candles.
- The first candle is a bearish candle with a long real body.
- The second candle is a smaller bullish candle that is completely contained within a vertical range of a previous body.
|
Bullish Harami Candlestick Pattern Reliability
|
A bullish Harami candlestick pattern is usually considered a trend reversal signal. According to our research, this pattern can be used as a reversal signal in a downtrend. Weekly patterns usually give more reliable reversal signals than daily patterns. The really important factor that affects the pattern reliability and profitability is the direction of a current weekly trend.
Both daily and weekly bullish Harami patterns in an uptrend are continuation signals, and they indicate higher probability that a current uptrend will resume. Daily patterns give more reliable continuation signals in a rising trend than weekly patterns.
Both daily and weekly bullish Harami patterns reversal and continuation signals are significantly more reliable, and the Gain/Loss ratio is much higher when a current parent trend is rising.
|
Daily Patterns |
Weekly Patterns |
| Frequency |
High |
Very High |
| Appears in downtrend |
69% |
81% |
| Reversal in downtrend |
40% |
56% |
| Reversal in downtrend when parent trend is up |
84% |
93% |
| Reversal in downtrend when parent trend is down |
13% |
26% |
| Continuation in uptrend |
67% |
52% |
| Continuation in uptrend when parent trend is up |
88% |
82% |
| Continuation in uptrend when parent trend is down |
18% |
9% |
| Avg. Gain/Loss Ratio in Downtrend |
1.41 |
2.03 |
| Avg. Gain/Loss Ratio in Uptrend |
2.86 |
1.36 |
|
Bullish Harami Trading Tips and Techniques
|
Some traders suggest that first Harami candlestick body should be no longer than 25% the size of the second candle, but our research does not show any evidence that Harami bullish candlestick body makes any real difference to the pattern reliability and profitability. A price near the Lower Bollinger Band, below 20, 50 and 100 Day Moving Average and Parabolic SAR improves the daily uptrend continuation signals performance as well.
Oversold momentum technical indicators substantially improve uptrend continuation signals reliability and Gain/Loss ratio for both daily and weekly patterns, but do not noticeably improve downtrend reversal signals performance.
|
Bullish Harami Examples
|
|
Example #1: Weekly downtrend reversal and rising trend continuation signals
The following chart of Nordstrom, Inc. (JWN) shows two bullish Harami patterns. The first pattern, formed by two weekly candles (Week1: Sep. 21- Sep.25, 2020, Week 2: Sep. 28 - Oct. 2, 2020) at the end of a weekly downtrend (Aug. 14 - Sep. 24, 2020), presents a downtrend reversal signal. The second bullish Harami pattern was formed by weekly candles (Nov.26 - Nov 30, 2020 and Nov. 2 - Nov. 6, 2020) as a rising trend continuation signal.
For the first bullish Harami pattern, a Candlestick/SAR technique generates the following trading signals:
October 5, 2020:
- Buy on market open at $13.
- Set stop-loss at $11.72 (the pattern low).
|
February 26, 2021:
- Sell at $35.55.
- Gain: 173.46% in 99 business days.
|
For the second bullish Harami pattern, a Candlestick/SAR technique generates the following trading signals:
November 9, 2021:
- Buy on market open at $15.97.
- Set stop-loss at $11.88 (the pattern low).
|
February 26, 2021:
- Sell at $35.55.
- Gain: 122.6% in 74 business days.
|
Example #2: Daily downtrend reversal signal.
The price chart of Ford Motor (F) above shows a Harami candlestick pattern formed on April 29 -30, 2021 that signaled a reversal of a daily downtrend and a beginning of a new rising trend. The first candle of the Harami pattern had a bearish long real body. The second candle is completely contained within a vertical range of the previous body, and its real body is only 27.7% present of the previous body.
The Candlestick/SAR technique generated the following trading signals:
May 3rd, 2021:
- Buy on market open at $11.56.
- Set stop-loss at $11.14 (the pattern low).
|
June 10th, 2021:
- Sell at $15.28.
- Gain: 32.18% in 27 business days.
|
Example #3: Daily rising trend continuation signal.
The chart of Best Buy Co., Inc. (BBY) below shows an example of a daily bullish Harami candlestick pattern formed on March 8, 2000 during a rising daily trend that started on February, 28 and continued until April 3, 2000. The pattern presented a rising trend continuation signal.
The Candlestick/SAR technique generated the following trading signals:
March 9, 2000:
- Buy on market open at $26.94667.
- Set stop-loss at $25.94667 (the pattern low).
|
April 4, 2000:
- Sell at $36.
- Gain: 33.6% in 18 business days.
|
|


|