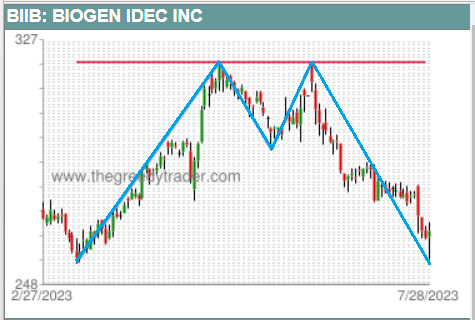
A double top pattern is a bearish formation that appears in an uptrend. It occurs when the price rallies sharply, then retreats to an intermediate low, and then retests the previous high without breaking it. A double top pattern indicates that the bearish sentiment is strong, the bulls are unable to break a significant resistance level, and after reaching the same high price twice in a row, the uptrend reverses. A double top pattern signals the start of a new downtrend. The price falling below the intermediate low confirms the trend reversal. The pattern looks like an upside-down letter “W”. A double top is the reversed image of a double bottom pattern and in many ways they are very similar.
Our
Chart Patterns Screener allows users to see a list of stocks that formed a double top chart pattern in daily, weekly, monthly, quarterly and yearly time frames. The presence of the double top pattern in the stock’s price time frame is indicated by the following icon -

.