|
Home > Technical Analysis Tutorial > Candlestick Patterns
|
Candlestick Pattern Tools
Our Candlestick Pattern Tools
|
TheGreedyTrader.com provides a variety of tools for different candlestick pattern trading techniques in daily and weekly time frames. These tools include:
- A Candlestick Scanner that recognizes thirty five bullish and thirty five bearish daily and weekly patterns.
- A list of recent daily and weekly candlestick patterns for S&P 500 index members and a variety of indexes and ETFs.
- An Advance Technical Scanner that allows searching stocks for specified candlestick patterns that match selected technical indicators criteria, trend direction, and chart pattern conditions.
- A personal list of selected search filters saved as private alerts.
- A personal list of selected stocks saved as a private watch list that indicates if any of the stocks have daily or weekly candlestick patterns.
|
List of recent daily and weekly candlestick patterns
|
Select a "Daily Candlestick Patterns" item under the Alerts menu or click here to see a list of recent daily candlestick patterns.
|
|
|
|
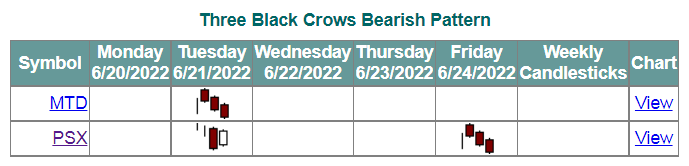
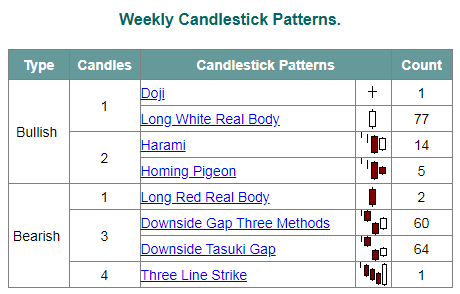
The list of daily candlestick patterns is sorted by type (bullish or bearish) and a number of candles in the pattern. The list shows the candlestick name, an icon and the number of recently identified patterns. A Candlestick Name column presents a link to the Candlestick Details page. For example, if you click on the "Three Black Crows" link, it will open the list of stocks that formed this candlestick pattern during the previous week. The "Weekly Candlesticks" column shows if a stock formed any weekly candlestick pattern last week.
|
|
|
The "View" link in the Chart column opens the Candlestick Chart Viewer. It has two buttons to show daily or weekly candlesticks chart.
|
|
|
|
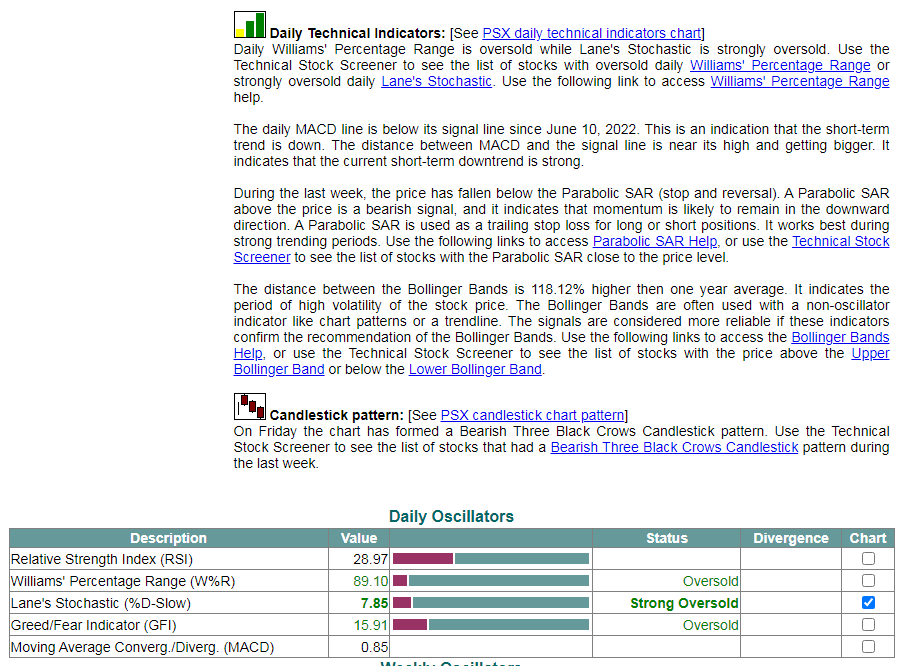
The stock symbol in the "Symbol" column on the Candlestick Details page is a link to the Stock Technical Signals page. This page displays the technical information that we have for each stock including candlestick patterns, the momentum and the trend following technical indicators, the wave analysis, and chart patterns in different time frames. The image below shows a fragment of this page related to a daily time frame.
|
|
|
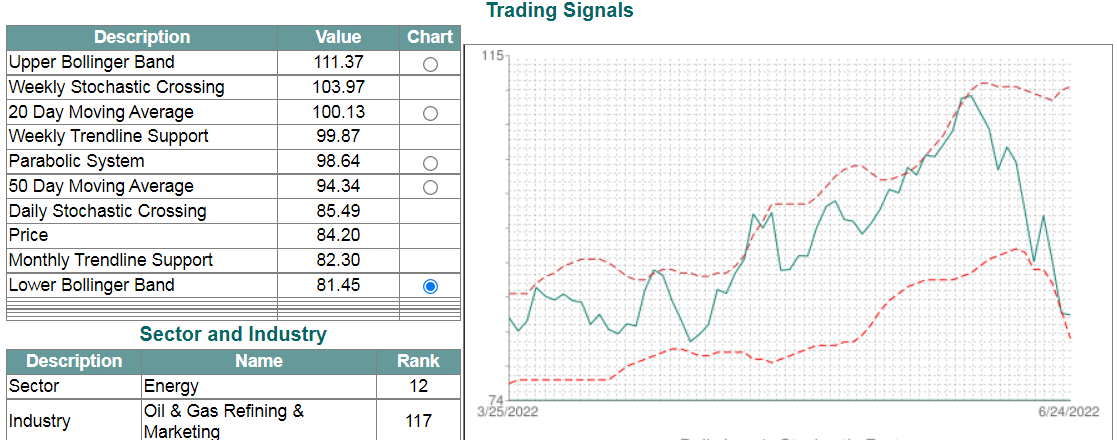
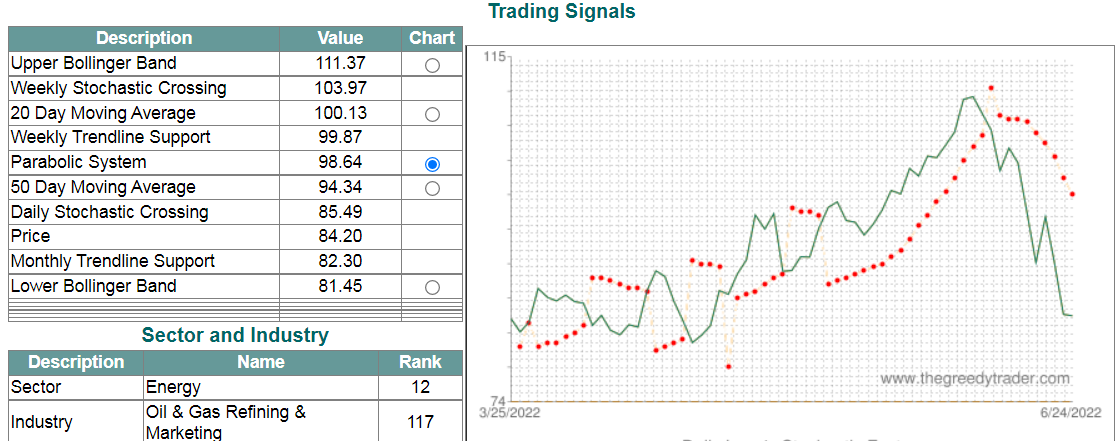
The Stock Technical Signals page shows the current stock price vs the current values of different technical indicators including current 20 and 50 Day Moving average, Upper and Lower Bollinger Band, Parabolic SAR, and it allows a user to see the above indicators on the price chart.
|
|
|
The user can select a "Weekly Candlestick Patterns" item under the Alerts menu or click here to see a list of recent weekly candlestick patterns. The Weekly Candlestick Patterns is very similar to the daily screen described above.
|
|
Candlestick Pattern Technical Screener - How to Use
|
|
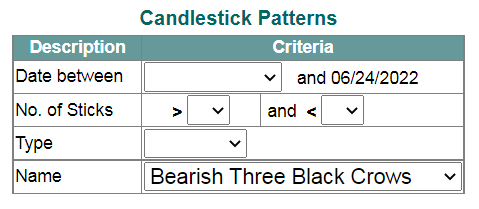
In order to use more sophisticated candlestick pattern trading techniques, the user can utilize our Advance Technical Scanner. It allows searching specified candlestick patterns with selected technical indicators criteria, trend direction, and chart pattern conditions. "Candlestick Patterns" section at the bottom of this page allows users to select the candlesticks by type (bullish or bearish), by number of candles, or by a pattern name.
|
|
|
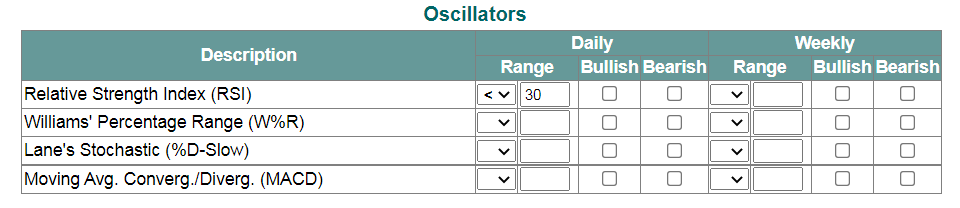
The image above shows the "Candlestick Patterns" section of the Advance Technical Screener with selected Bearish Three Black Crows pattern. Another section of the Scanner allows to select scanning parameters for the daily and weekly oscillators including Relative Strength Index (RSI), Williams' Percentage Range (W%R), Lane's Stochastic (%D-Slow), and Moving Average Convergence/Divergence (MACD). The image below shows the Oscillators section of the Screener with selected daily Relative Strength Index less than 30%.
|
|
|
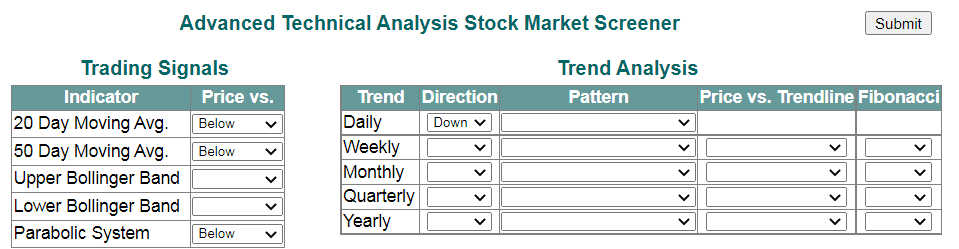
Two sections at the top of the Screener are "Trading Signals" and "Trend Analysis". The Trading Signals section allows selecting search criteria related to the stock price. Users can select the stocks with the price above, below or crossover Moving Averages, Bollinger Bands, and Parabolic SAR. The image below shows the selection when the stock price should be below 20 and 50 Day Moving Average and below Parabolic SAR.
|
|
The Trend Analysis section allows to filter daily, weekly, monthly, quarterly, and yearly trend directions and chart patterns as well as stock price vs support and resistance trend lines. The image above shows selected daily trend direction down. You can click here to find more information how to use the Advanced Technical Screener.
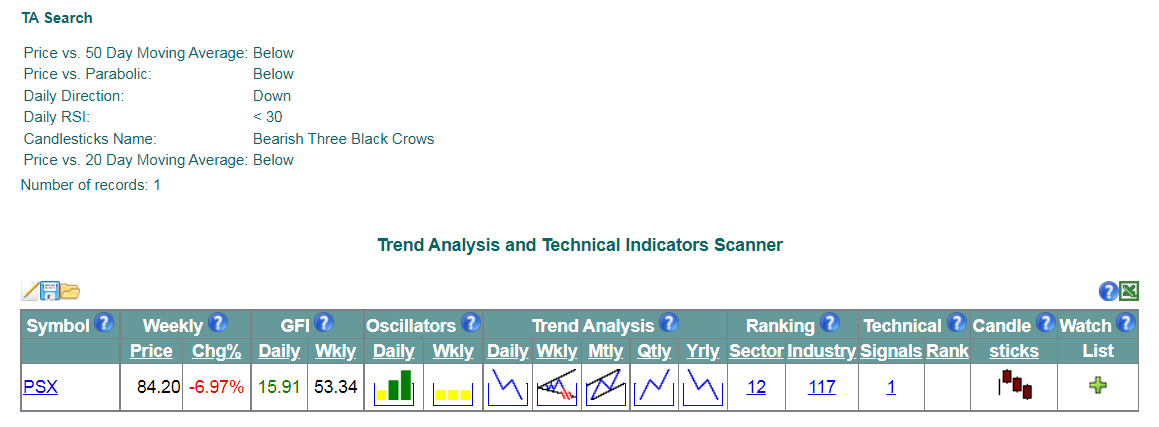
After all filter criteria are selected, users can click a Submit button at the top right corner of the screen to see the search results on the next screen. The image below shows the search result for the criteria selected on the Advance Technical Screener images described above. All selected criteria are listed at the top left corner of the screen under the "TA Search" title. The grid below shows a list of stocks that match the selected criteria.
|
|
The stock symbol in the "Symbol" column is a link to the Stock Technical Signals page, and the pattern icon in the Candlesticks column opens the Candlestick Chart Viewer popup window. You can click here to find more information about Trend Analysis and Technical Indicators page.
There are three icons above the left corner of the grid  . The first is the Edit icon  allows users to go back to the Advance Technical Scanner and edit the selected criteria. The Save icon  allows users to save the selected criteria as a personal Filter in order to rerun the search later.
|
|
|
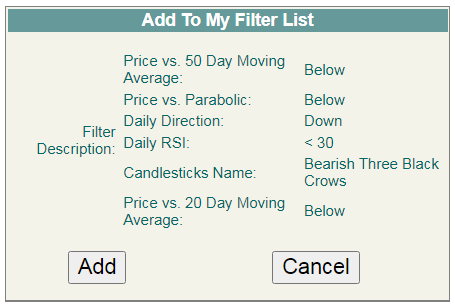
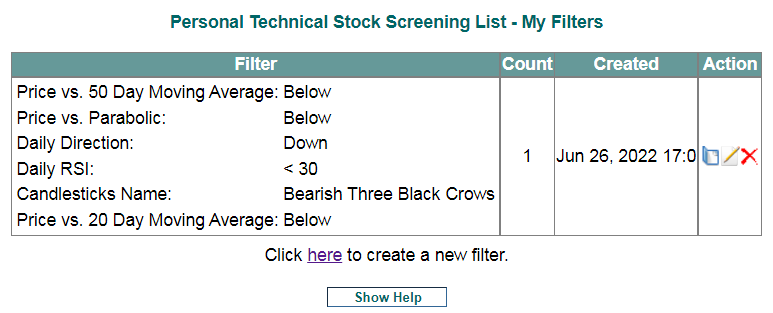
The Save button opens the confirmation popup page to allow users to review the selected filter criteria and confirm the new filter. When users click on the Add button, a new filter will be added to "My Filters" list, and users will see the My Filters page with the list of all personal saved filters including a newly added filter.
|
|
Users can open the list of personal Filters by selecting a My Filters submenu under the Analysis menu. You can click here to find more information how to save and use saved personal Filters.
In addition, users can add the selected stock to the personal Watch List by clicking on the  icon in the Watch List column. Doing this allows a user to create his own list of stocks to keep an eye on the price, technical indicators, trend analysis, as well as daily and weekly candlestick patterns. Users can open the personal Watch List by selecting a Watch List submenu under the Analysis menu.
|
 
|