| Home > Technical Analysis Tutorial > Candlestick Patterns
|
Hammer Candlestick Pattern
How to identify a Hammer Candlestick Pattern
|
A Hammer candlestick pattern occurs in a down wave and reminds a hammer shape that has a small real body and a long lower shadow.
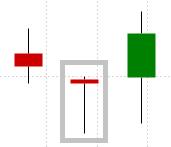
- An upper shadow is very short and the lower shadow is at least twice as long as the real body.
- The candle can close below or above opening price, but always near it.
|
|
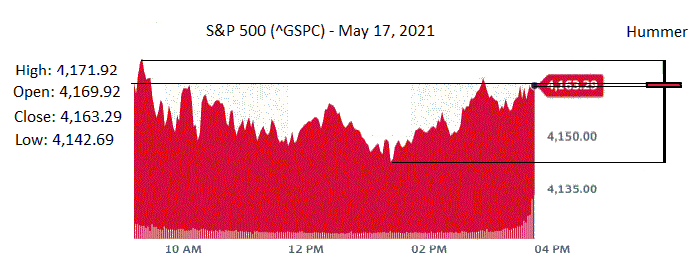
The image below shows S&P 500 index intraday price chart on May 17, 2021, that forms a bullish Hammer candlestick pattern.
|
|
|
Usually a candlestick with a long shadow in established trend is considered as a reversal sign. Single candlestick patterns with long lower shadow are Hammer, Shooting Star, Hanging Man, and Dragonfly Doji. Hammer and Hanging Man patterns look exactly the same. The only difference is that Hammer appears in a falling trend, while Hanging Man appears in a rising trend. They both have a long lower shadows and short real bodies, which shows that an initial selling pressure pushed the price lower, but this move was not sustainable, and the change in market sentiments lead to the buying pressure moving the price back up and close near the open price. When a closing price is equal to an opening price, the Hammer candlestick became a DragonFly Doji. A Shooting Star candlestick is similar to the Hanging Man, and it appears in an uptrend, but looks like an inverted (horizontally rotated) Hummer. A Shooting Star candlestick has a long upper shadow and short real body. All these patterns with long upper or lower shadow indicate an uncertainty in market sentiments and may signal a trend reversal.
|
Hammer Candlestick vs Multi-Candlestick Patterns
|
|
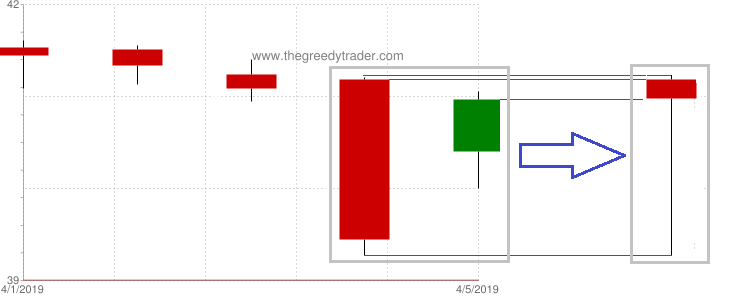
Some multi-candle candlestick patterns are often converting to a Hammer candlestick when presented in a different time unit. The following image shows a bullish Harami candlestick pattern formed on daily Following FirstEnergy Corp. (FE) chart on April 5th, 2019. If we present the same chart using two-days candlestick time unit, it would convert the Harami candlestick pattern into the Hammer candlestick.
|
|
|
Similar relationship often exists between Hammer candlestick and other multi-candlestick patterns, like Piercing Line, Engulfing, Three Inside Up and many other multi-candlestick patterns.
|
Hammer Candlestick Pattern Reliability
|
Daily Hammer patterns are more reliable when momentum technical indicators are oversold. Some traders consider that a Hammer real body should be below the previous candle body. Our data shows that this signal is more reliable and Gain/Loss Ratio is significantly higher when the Hammer candle open price is lower than a previous candle close price.
Some traders wait for a reversal confirmation when the candle following a hammer closes above the closing price of a hammer. Our research also suggests that this confirmation significantly improves the signal reliability and profitability.
|
Daily Patterns |
Weekly Patterns |
| Frequency |
Very High |
Very High |
| Appears in downtrend |
N/A |
N/A |
| Reversal in downtrend |
29% |
53% |
| Reversal in downtrend when parent trend is up |
45% |
89% |
| Reversal in downtrend when parent trend is down |
24% |
21% |
| Continuation in uptrend |
N/A |
N/A |
| Continuation in uptrend when parent trend is up |
N/A/td>
| N/A |
| Continuation in uptrend when parent trend is down |
N/A |
N/A |
| Avg. Gain/Loss Ratio in Downtrend |
1.18 |
1.89 |
| Avg. Gain/Loss Ratio in Uptrend |
N/A |
N/A |
|
Market Sentiments
|
Usually a long upper or lower shadow indicates uncertainty and changes in market sentiments. A Hammer candle formation indicates that during the candle's period sellers pushed price significantly lower, but the new low price could not hold. The lower price attracted more buyers, and the price retreated back close to the opening price. It indicates that market sentiments sharply changed from bearish to bullish.
|
Hammer Examples
|
|
Example #1: Daily downtrend reversal signal.
Below is the chart of the Pulte Homes, Inc. (PHM). On January 9th, 2008 it formed a daily bullish Hammer candlestick. The daily down wave was in progress. The price was below 20-Day, 50-Day, and 100-Day Moving Averages and close to the Lower Bollinger Band. Relative Strength Index (RSI) was oversold and Williams' Percentage Range and Lane's Stochastic were strongly oversold. The Hammer candlestick signaled a downtrend reversal. The new up wave started on January 9th, 2008 at $8.2 and ended on January 31st, 2008 at $16.63.
January 10, 2007:
- Buy on market open at $8.85.
- Set stop-loss at $8.2 (the pattern low).
|
February 6, 2007:
- Sell at $14.23.
- Gain: 60.79% in 18 business days.
|
Example #2: Daily downtrend reversal signal.
Below is the chart of the Pulte Homes, Inc. (PHM). On March 17th, 2015 it formed a daily bullish Hammer candlestick. The daily down wave was in progress with a price below 20 day moving average. The Relative Strength index (RSI) was oversold and Williams' Percentage Range and Lane's Stochastic were strongly oversold. The Hammer candlestick signaled a downtrend reversal. The new up wave started on March 17th at $20.59 and ended on April 6th 2015 at $22.95, making 11.46% gain in 13 business days.
According to our candlesticks trading strategy, we could buy PHM on March 18, 2015 at a market open price $20.99. On the next chart you can see the Parabolic SAR sell signal on April 17th. It would sell our holdings at a market open price $22.11, making 5.34% gain in 22 business days.
The Candlestick/SAR technique generated the following trading signals:
March 18, 2015:
- Buy on market open at $20.99.
- Set stop-loss at $45.58 (the pattern low).
|
April 17, 2015:
- Sell at $22.22.
- Gain: 5.34% in 22 business days.
|
It is important to emphasize that the Parabolic SAR issued a warning sell signal on April 17th, just a few days before the PHM price dropped 10.01% in three business days from $22.21 close price on March 21st to $19.97 close on March 23rd. This example shows why it is important to use trailing stop loss technique like Parabolic SAR to “lock in” profit, since we are not able to predict how long an uptrend will last.
Example #3: Weekly downtrend reversal signal.
A weekly Hammer candlestick pattern on the price chart of Vertex Pharmaceuticals (VRTX) bellow appears at the end of a weekly downtrend. The pattern was a downtrend reversal signal that marked a beginning of a new weekly rising trend.
| VRTX: Vertex Pharmaceuticals
|
|
|
|
The Candlestick/SAR technique generated the following trading signals:
March 17, 2008:
- Buy on market open at $15.07.
- Set stop-loss at $3.84 (the pattern low).
|
August 4, 2008:
- Sell at $28.08.
- Gain: 86.33% in 97 business days.
|
|


|