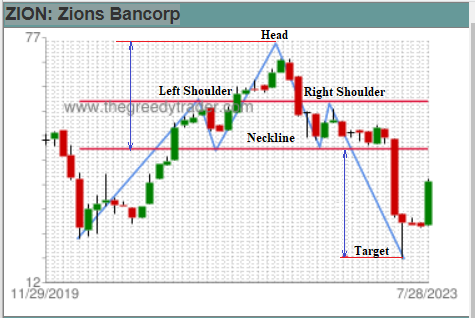
Head and Shoulders is one of the most popular and reliable chart patterns that indicate a bearish reversal. The pattern consists of three peaks that resemble the formation of a head and two shoulders. The first (left) and third (right) peaks are roughly at the same level and are called shoulders. The second (middle) peak reaches the highest level in the pattern and is called the head. The two lows that occur between the peaks are also at a similar level. The line that connects these lows is called the neckline. A price move below the neckline is often considered as a confirmation of the pattern and a signal to sell. The price difference between the head and the neckline is often used to calculate the distance between the entry point and the target price.
Our
Chart Patterns Screener allows users to see a list of stocks that formed a Head and Shoulders chart pattern in daily, weekly, monthly, quarterly and yearly time frames. The presence of the Head and Shoulders pattern in the stock’s price time frame is indicated by the following icons:

- Head and Shoulders Pattern

- Confirmed Head and Shoulders Pattern

- Head and Shoulders Pattern with price near the neckline

- Invalidated Head and Shoulders Pattern