| Home > Technical Analysis Tutorial > Chart Patterns
|
Chart Patterns
Support and Resistance Lines
|
|
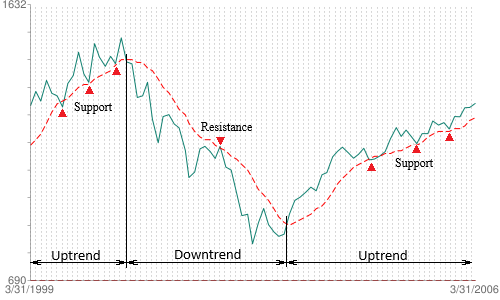
Support and resistance are zones on a chart that have a higher probability of changing the market sentiments, which may lead to a reversal in the price trend. These zones are based on historical patterns and show where buyers and sellers most likely enter and exit the market. A support level indicates an area where a downtrend is likely to reverse, and there is a high probability of a new uptrend beginning. Similarly, the resistance level indicates the area where a rising trend is likely to reverse. A support level can become a reversal level and vice versa. If the support level is broken and the price moves below the support, the former support level becomes a new resistance level for the subsequent rising wave. Technical analysis uses the following techniques to identify the support and resistance levels: horizontal lines, trendlines, Fibonacci retracements, moving averages, and round numbers.
|
Horizontal Support and Resistance Lines
|
Reversal points in price trends mark the local high and low levels of the price. Market participants use these price levels in their trading strategies. For example, some traders use those low and high price levels as limit, stop-loss, or stop-limit trade orders. Those orders become significant barriers to future trends. Those levels create horizontal support and resistance lines. The horizontal support and resistance lines usually correspond to the time frame of the trend. The lines tend to be more critical when they are associated with a more significant trend reversal time frame. The technical indicators of oversold and overbought conditions, such as the Relative Strength Index, Williams’ Percentage Range, or Lane’s Stochastic, make the support and resistance levels stronger. Horizontal support and resistance, play an essential role in many chart patterns like the Ascending and Descending Triangles, the Double Top and Triple Top, and the Double Bottom and Triple Bottom patterns.
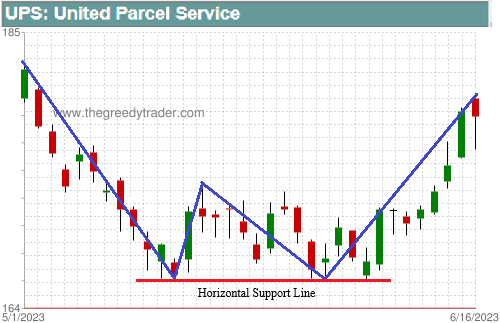
The United Parcel Service (UPS) chart below shows a weekly Double Bottom pattern that was formed by a horizontal support line. The weekly downtrend that started on April 20, 2023, at $197.8 reached $166.15 on May 16, 2023, and then reversed. The trend lowest price of $166.15 became the new support level that was retested on June 6, 2023. The UPS stock price could not break a horizontal support line at $166.15 and formed a weekly Double Bottom chart pattern.
|
 |
|
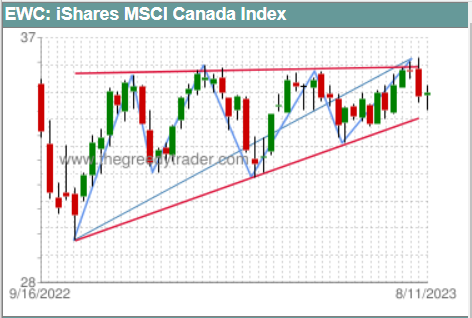
The following chart of the iShares MSCI Canada Index (EWC) formed a monthly Ascending Triangle pattern between October 13, 2022, and July 31, 2023. This pattern has a resistance trendline formed by a horizontal resistance line.
|
 |
Trend Support and Resistance
|
The financial market does not exhibit constant movement in a singular direction; rather, stock prices move in waves. These waves, when moving in the same direction, signify a price trend. A rising trend is characterized by price waves making higher highs and higher lows, while a falling trend occurs when price waves are making lower highs and lower lows. In a sideways trend, the security price moves within a trading range, where waves reach both high and low points without significant upward or downward movement for a certain period of time.
Price waves have a hierarchical structure. Longer waves are formed by smaller sub waves. To better understand the stock price trend, the waves should be analyzed in different time frames in order to see the whole picture. TheGreedyTrader.com website presents trend analysis in five different time frames.
| Time Frame |
Average Length |
Description |
| Daily |
6 business days |
Short-term |
| Weekly |
12 business days |
Short-term |
| Monthly |
6 weeks |
Intermediate |
| Quarterly |
16 weeks |
Intermediate |
| Yearly |
48 weeks |
Long-term |
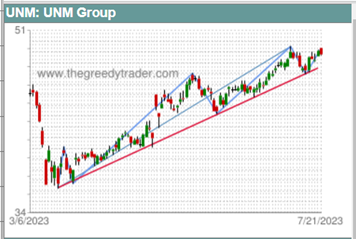
The red line on the chart of UNM Group (UNM) below shows a monthly rising trend support line.
|
|
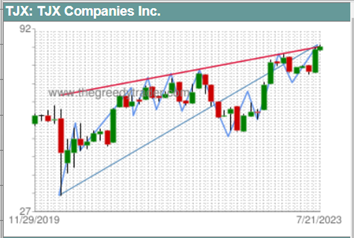
Below is an example of the monthly trend resistance line on the price chart of TJX Companies Inc. (TJX).
|
|
The line that connects the trend's lower points on the chart is called a support trendline. The line that connects the trend's highs is called a resistance trendline. Trendlines are a very popular technique to identify possible price support or resistance levels. A trend should have at least two low points or high points to create a trendline. The trend support line is usually considered as a buying opportunity, while the trend resistance line is a selling signal. The more high or low points the trendline connects, the more significant trading signal it presents. Trend support and resistance lines may also be the trend reversal signals. To distinguish between trend support/resistance and reversal points, the higher level trend should be analyzed, along with momentum and trend-following technical indicators in several different time frames.
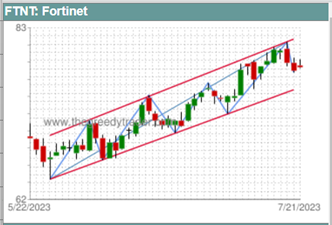
Support and resistance trendlines also play a significant role in chart pattern recognition. For example, a Channel Pattern occurs when support and resistance trendlines are parallel, while a wedge pattern is usually characterized by converging support and resistance trendlines.
Below is an illustrative example of a weekly rising channel pattern observed in the chart of Fortinet (FTNT).
|
|
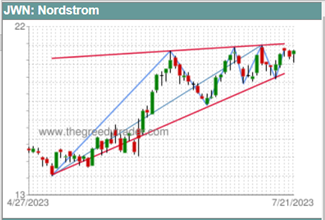
Below is an example of the monthly Rising Wedge pattern on the price chart of Nordstrom (JWN).
|
|
TheGreedyTrader.com Support & Resistance Trendline Screener
|
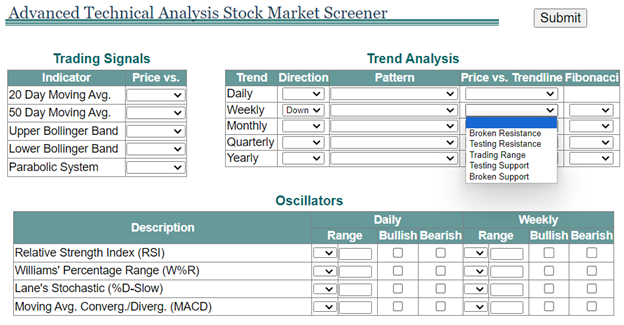
TheGreedyTrader.com provides a Trend Analysis Screener that allows users to search daily, weekly, monthly, quarterly, and yearly time frames to identify various trend parameters:
- trend direction (up or down)
- trend support and resistance status (Broken Resistance, Testing Resistance, Trading Range, Testing Support, Broken Support)
The chart pattern scanner allows you to search trend support and resistance lines by the current status (Broken Resistance, Testing Resistance, Trading Range, Testing Support, Broken Support) as well as combine the pattern search with momentum and trend-following indicator parameters.
|
 |
Fibonacci Retracement Support and Resistance Lines
|
The Fibonacci Retracement technique is based on a sequence of numbers introduced to the West by Italian mathematician Fibonacci in the 13th century. The technique suggests that the price retracement ratio between two consecutive market waves is likely to be close to one of the ratios between the Fibonacci numbers: 23.6%, 38.2%, 50%, 61.8%, or 100%. Fibonacci Retracement ratios present horizontal support and resistance lines and predict the pullback retracement level. It allows traders to set a trade target price and stop-loss orders. The Fibonacci Retracement technique works better when used in combination with other technical analysis indicators and chart patterns.
|
 |
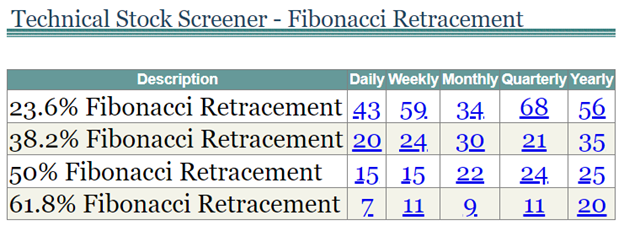
Our Fibonacci Retracement Screener enables users to find stocks that are close to the Fibonacci Retracement levels in various time frames. By using our screener, users can discover the possible support and resistance lines for daily, weekly, monthly, quarterly, and yearly trends.
|
 |
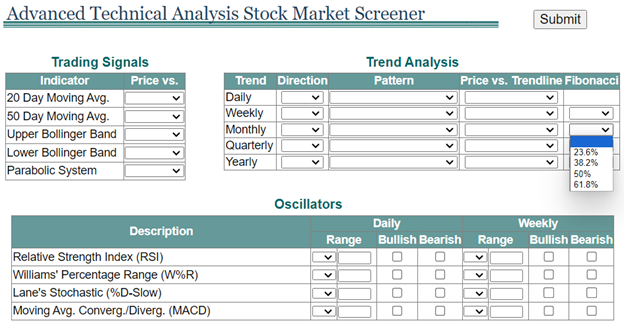
In addition, our Technical Analysis Filter allows combining the Fibonacci Retracement filter with some technical indicators criteria such as moving averages, overbought/oversold indicators, and bullish or bearish divergence.
|
 |
Moving Averages Support and Resistance Lines
|
Moving Averages are often viewed as support or resistance lines. Typically, the 20 or 50-day moving averages are used in shorter-term charts. For the long-term charts, 100 or 200-day moving averages are often used as support and resistance lines. In a rising trend moving average works as a support line while in a falling trend, it became a resistance line. The moving average support breakdown indicates an uptrend reversal. Similarly, a moving average resistance breakout is a downtrend reversal signal.
The chart below shows the S&P 500 (^GSPC) price and its 200-day moving average, which serves as a support line during an uptrend and as a resistance line during a downtrend. The price fell below the 200-day moving average support line on November 9, 2000. This signaled that the S&P 500 uptrend was over and a long-term downtrend had begun. From November 9, 2000, to April 14, 2003, the S&P 500 was in a downtrend, and the 200-day moving average acted as a resistance line. On April 14, 2003, the price broke above the 200-day moving average, signaling the end of the long-term downtrend and the start of a new rising trend.
|
 |
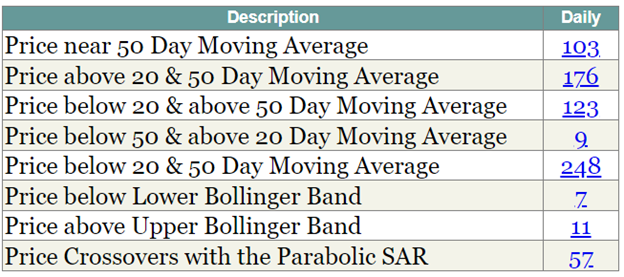
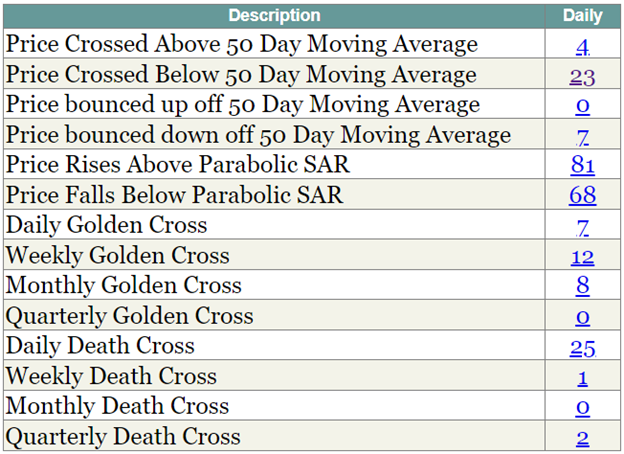
TheGreedyTrader.com Technical Analysis Stock Screener allows users to find a list of stocks that match some predefined criteria. Following is a list of such criteria:
- Price near 50 Day Moving Average
- Price above 20- & 50-Day Moving Average
- Price below 20 & above 50 Day Moving Average
- Price below 50 & above 20 Day Moving Average
- Price below 20- & 50-Day Moving Average
- Price Crossed Above 50 Day Moving Average
- Price Crossed Below 50 Day Moving Average
- Price bounced up off 50 Day Moving Average
- Price bounced down off 50 Day Moving Average
|
 |
 |
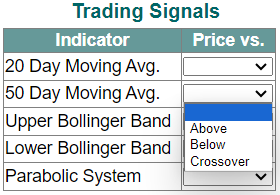
Additionally, our TA Filter allows users to find a list of stocks that have prices above, below, or crossing over the 20- or 50-day moving averages.
|
 |
Round Numbers as Support and Resistance Lines
|
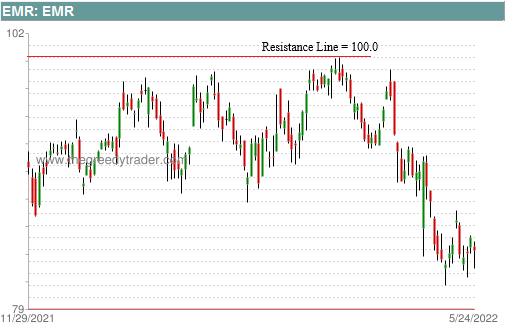
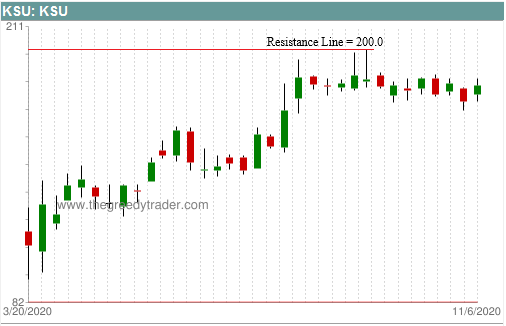
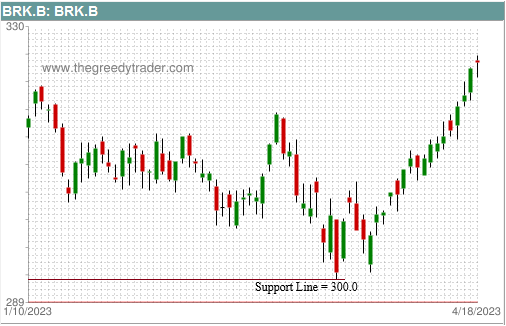
Traders and investors often use round numbers as a convenient way to place trading orders. Some round numbers draw attention as psychological levels. For example, articles with titles such as “Why Dow 18,000 may matter” (in 2016) or “S&P 500 Forecast: Shows Resilience, 4500 Level Resistance” draw attention to the price levels mentioned in the articles. Such round numbers can act as significant support or resistance levels. The charts below show two cases of round number resistance lines and one case of round number support line.
|
 |
 |
 |


|