| Home > Technical Analysis Tutorial > Candlestick Patterns
|
Piercing Line Candlestick Pattern
How to identify a Piercing Line Pattern
|
A Piercing Line is a very common two-day candlestick pattern.
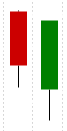
- The pattern consists of two candles.
- The first candle is bearish and has an average or above average real body.
- The second candle is bullish with an average or above average real body as well.
- The second candle opens lower than the first candle close price.
- The second candle closes above the 50% of the first candle body below the first candle open.
|
Piercing Line Candlestick Pattern Reliability
|
|
A Piercing Line candlestick pattern is usually considered as a reversal pattern which works better in downtrends.
According to our research, a daily Piercing Line candlestick pattern appears more often in daily downtrend and serves as a reversal signal with an average reliability. The reliability of a reversal signal is significantly higher if a parent's weekly trend is up, and it is lower if a parent's trend is down. In a daily uptrend, a Piercing Line pattern usually appears after a short price retreat or a pause, and it is a pretty reliable continuation signal. Trading daily Piercing Line pattern in daily uptrend is one of the most profitable bullish candlesticks trading technique with an average Gain/Loss ratio equal 4.55.
A weekly Piercing Line pattern appears mostly in a weekly downtrend as a reversal signal with an above average reliability. A reliability of the reversal signal is significantly higher if a parent's monthly trend is up, and it is lower if a parent's trend is down. Using a weekly Piercing Line pattern in weekly downtrend as a reversal signal presents is a pretty profitable trading technique with an average Gain/Loss ratio 2.41. In a weekly uptrend, a weekly Piercing Line pattern is a reliable continuation signal with an above average reliability, and it indicates an end of a temporary retreat and signals a continuation of a weekly uptrend. A weekly pattern is a profitable uptrend continuation signal with an average Gain/Loss ratio 1.96.
|
|
Daily Patterns |
Weekly Patterns |
| Frequency |
Very High |
High |
| Appears in downtrend |
58% |
76% |
| Reversal in downtrend |
41% |
71% |
| Reversal in downtrend when parent trend is up |
73% |
95% |
| Reversal in downtrend when parent trend is down |
31% |
34.5% |
| Continuation in uptrend |
83% |
62.3% |
| Continuation in uptrend when parent trend is up |
93% |
85.7% |
| Continuation in uptrend when parent trend is down |
38.4% |
13.2% |
| Avg. Gain/Loss Ratio in Downtrend |
1.36 |
2.41 |
| Avg. Gain/Loss Ratio in Uptrend |
4.55 |
1.96 |
|
Market Sentiment
|
|
A first Piercing Line pattern candle is a bearish candle with an average or above average body that usually appears in a downtrend or after a short retreat in an uptrend. It indicates bearish market sentiments that increase next morning when a price opens with a gap down. However, during a second candle period buyers step in and move price significantly higher. The pattern indicates a sharp change in market sentiments that may predict downtrend's reversal and present a buying opportunity.
|
Piercing Line Trading Tips and Techniques
|
One of two Piercing Line candles that make a lower low marks a downtrend's reversal point. This price level can serve as a stop-loss point. Otherwise, to reduce a risk, a stop-loss order can be placed right below the second candle open price. On one hand, moving a stop-loss price higher reduces the risk; on the other hand, it increases a risk of getting out of a successful trade.
Our research shows that reliability of a downtrend reversal signal and Gain/Loss ratio significantly increases when a parent's trend is up for both daily and weekly patterns. Technical traders often consider the next day close price as a reversal confirmation if it is higher than the pattern close price. This confirmation makes a reversal signal much more reliable, but waiting for this confirmation would decrease the Gain/Loss ratio.
In a daily downtrend, oversold daily momentum technical indicators slightly improve the signal reliability and profitability of the daily Piercing Line pattern. A price near a Lower Bollinger Band improves the daily pattern reversal signal reliability and Gain/Loss ratio as well. Both daily and weekly patterns reliability and profitability improve, when the price is below the daily/weekly Parabolic SAR. Price rising above Parabolic SAR confirms the downtrend's reversal signal.
|
Bullish Piercing Line Examples
|
|
Example #1: Daily downtrend reversal Piercing Line pattern
The AES Corp. (AES) chart above shows a daily Piercing Line candlestick pattern formed on March 18th - March 19th, 2020. The pattern appears in a daily downtrend (February 18th - March 18th) and signals the trend reversal.
The Candlestick/SAR technique generates the following trading signals:
March 20, 2020:
- Buy on market open at $11.21.
- Set stop-loss at $8.11 (the pattern low).
|
April 13, 2020:
- Sell at $13.75
- Gain: 22.66% in 17 business days.
|
Example #2: Daily uptrend continuation signal.
The next chart presents an example of a daily Piercing Line candles pattern in a daily uptrend, where it is usually a continuation signal.
| AAL: American Airlines Group
|
|
|
|
The American Airlines Group (AAL) chart above shows a daily uptrend that started on October 26, 2016 at $38.21. After a bullish week, the uptrend retreated for several days and then formed a Piercing Line pattern on November 3rd - November 4th. The pattern marked the end of a short term price retreat and a continuation of a daily uptrend.
The Candlestick/SAR technique generates the following trading signals:
November 5, 2016:
- Buy on market open at $40.39.
- Set stop-loss at $39.24 (the pattern low).
|
November 30, 2016:
- Sell at $45.92.
- Gain: 13.69% in 17 business days.
|
Example #3: Weekly downtrend reversal signal.
The chart of the CurrencyShares Mexican Peso Trust (FXM) below shows an example of a weekly Piercing Line pattern as a weekly downtrend reversal signal. The weekly Piercing Line pattern was formed by two weekly candles (week Jan. 11 - Jan. 15, 2016 and week Jan. 19 - Jan. 22, 2016). The pattern signaled the end of the weekly downtrend (Oct. 7, 2015 - Jan. 21, 2016) and the beginning of a new bullish trend ( Jan. 21, 2016 - May 2, 2016).
| FXM: CurrencyShares Mexican Peso Trust
|
|
|
|
The weekly Candlestick/SAR technique generates the following trading signals:
January 25, 2016:
- Buy on market open at $0.686.
- Set stop-loss at $0.51 (the pattern low).
|
May 20, 2016:
- Sell at $1.771.
- Gain: 158.16% in 84 business days.
|
Example #4: Weekly uptrend continuation signal.
The following chart of the Royal Caribbean Cruises Ltd (RCL) shows an example of a weekly Piercing Line pattern as a weekly uptrend continuation signal.
| RCL: Royal Caribbean Cruises Ltd
|
|
|
|
The pattern was formed by two weekly candles: week Mar.24 - Mar. 28 2003 and week Mar. 31 - Apr. 4, 2003. The pattern signaled that a weekly uptrend that started on March 7, 20003, is not over and bullish market sentiments would lead to a continuation of a current weekly rising trend.
The weekly Candlestick/SAR technique generates the following trading signals:
April 7, 2003:
- Buy on market open at $16.65.
- Set stop-loss at $14.6 (the pattern low).
|
September 25, 2003:
- Sell at $30.1565
- Gain: 81.12% in 119 business days.
|
|


|