| Home > Technical Analysis Tutorial > Technical Indicators
|
| The New 52-Week High/Low
|
|
|
The New 52-Week High/Low
|
The New 52-Week High/Low is an important technical signal that indicates a stock has been trading at its highest or lowest price in the past 52 weeks. The past 52-week highs/lows price is usually considered a significant support/resistance level. Trend reversal around this level is common and presents a psychological indicator when buyers fear missing out on a significant price increase, and sellers look to lock in gains or cut their losses.
Since the past 52-week highs/lows price is a significant support/resistance level, a stock usually cannot break it at the first attempt and makes multiple attempts before finally crossing this level. Momentum traders typically consider the 52-week high level as the prime target for profit-taking.
Traders often use the initial pullback from the past 52-week highs/lows prices in several trading strategies. One of the most common of these strategies is the “pop” strategy. According to this strategy, traders open positions when the price finally crosses the 52-week highs/lows level after the initial price retreats from this level.
|
New 52-Week Highs/Lows Ratio
|
|
The New 52-Week Highs/Lows Ratio (“NH/NL Ratio”) is another important technical indicator based on the New 52-Week High/Low signals. It represents the ratio between the number of stocks reaching new 52-week highs and the number of stocks reaching new 52-week lows. An NH/NL Ratio higher than one indicates that a larger number of stocks are making a new 52-week high than the number of stocks making a new 52-week low. Conversely, an NH/NL Ratio lower than one indicates that a larger number of stocks are making a new 52-week low than the number of stocks making a new 52-week high. The NH/NL Ratio is extremely low near the market bottom when a larger number of stocks are making a new 52-week low. When the market trend reverses from the bottom, the indicator moves up sharply.
|
Buying/Selling Climax
|
|
A Buying Climax occurs when a stock trend price reaches a 52-week high, and then closes the week with a loss. A Selling Climax occurs when a price reaches a 52-week low but the week closes above the opening price of the week. Both climaxes typically occur at the end of a long-term trend and are signs of trend exhaustion. Climaxes are usually preceded by either excessive euphoria at market peaks or excessive pessimism at market bottoms. They often result from the last rush of investors who buy into a rising market or sell into a declining market.
|
The New 52-Week High/Low Stock Screener
|
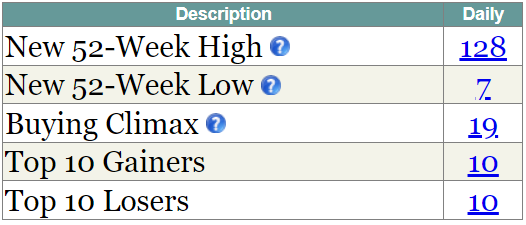
Users can access a curated list of stocks and exchange-traded funds (ETFs) that are currently trading at their highest or lowest prices within the past 52 weeks using our Technical Stock Screener. This page provides information on the number of new 52-week high and low stocks/ETFs. Additionally, users can find data on Buying and Selling Climaxes.
The numerical values displayed on the screen serve as hyperlinks, leading users to the Technical Indicators Scanner page, where they can explore a comprehensive list of stocks/ETFs that meet their selected criteria
|


|