| Home > Technical Analysis Tutorial
|
|
Technical Analysis Introduction
History of Technical Analysis
|
The first and oldest book about the stock exchange that provided the foundation for modern technical analysis and behavioral finance was written in the 17th century by Amsterdam-based merchant Joseph Penso de la Vega. His book "Confusion of Confusions", written in 1688, presented the history of speculation in stocks and the process of stock trading on the Amsterdam Stock Exchange. It describes the whole spectrum of sophisticated financial transactions, including options trading, futures contracts, margin buying, some forms of stock-index trading, and even bull and bear conspiracies. The book provides interesting documentation on investor biases, such as herding, overconfidence, and regret aversion.
De la Vega also came up with four basic rules of the share market that are still of the greatest relevance today.
The first rule in speculation is: Never advise anyone to buy or sell shares. Where guessing correctly is a form of witchcraft, counsel cannot be put on airs.
The second rule: Accept both your profits and regrets. It is best to seize what comes to hand when it comes, and not expect that your good fortune and the favorable circumstances will last.
The third rule: Profit in the share market is goblin treasure: at one moment, it is carbuncles, the next it is coal; one moment diamonds, and the next pebbles.
The fourth rule: He who wishes to become rich from this game must have both money and patience.
|

The Candlestick technique was created in the 1700s by a Japanese rice merchant from Sakata, Munehisa Honma, who traded in the Dojima Rice market in Osaka. Homma began recording the open, high, low and close of rice price movements each day. Soon he began seeing patterns and repetitive signals in the price bars he was drawing, and he started to give them names.
Analyzing those patterns, he realized that, while there was a link between the price and the supply and demand of rice, the psychological aspect of the market was critical to trading success, and traders’ emotions have a significant influence on the rice prices. The discovery of the price action patterns gave Homma a huge advantage over other traders and allowed him to become one of the most successful traders ever. He served as a financial advisor to the Japanese government and was raised to the rank of honorary Samurai.
In 1755, he published a book on market psychology "The Fountain of Gold - The Three Monkey Record of Money". The candlestick patterns he described in his books became known as the “Sakata Rules”. These Sakata Rules became the basis of modern candlestick charting, and thus most of what Homma wrote about is still relevant today.
|
In 1895, a French psychologist Charles-Marie Gustave Le Bon published his book "The Crowd: A Study of the Popular Mind", which is considered one of the most influential works on crowd psychology. Le Bon developed the view that crowds are not the sum of their individual parts, proposing that within crowds, there forms a new psychological entity, the characteristics of which are determined by the "collective unconscious" of the crowd.
|
In 1912, George C. Selden published his book "Psychology of the Stock Market: Human Impulses lead to Speculative Disaster". Selden was primarily studying and identifying human behavior patterns in the stock market. The suggestions and comments provided by Selden were designed to help traders to avoid unwise risks and apply sound principles of analysis.
|
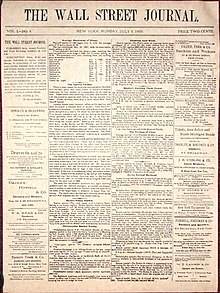
In 1899, Charles Henry Dow, a founder (and the first editor) of The Wall Street Journal, started an editorial column in his newspaper in order to educate the general reader. The 255 editorials written by Charles H. Dow later became the groundwork for technical analysis and are called the Dow Theory.
The basic idea of Dow is that the stock price is affected by various economic and political factors, leading to distinct patterns of stock price movement. By using historical market data, we can establish a relationship between these patterns and each important factor in order to predict the probable future movement of the stock price.
On October 25th, 1929, William Hamilton, editor of The Wall Street Journal and the successor to Charles Dow, predicted the great depression using the Dow Theory. He wrote in his most famous editorial "A Turn in the Tide", that the Dow Theory "gave the signal for a bear market in stocks". He noted that "There are people trading in Wall Street, and many all over the country, who have never seen a real bear market…. What is more material is that the stock market does forecast the general business of the country."
|
The first book on contemporary investment practices, 'Stock Market Theory and Practice' was published in 1930 by Richard Schabacker, which was followed in 1932 by "Technical Analysis" and in 1934 by "Stock Market Profits: A Course in Forecasting". His writing forms the basis of contemporary thought on the subject. He is known as "the father of technical analysis".
|
In the early 1930s, an American accountant, Ralph Nelson Elliott, began his systematic study of seventy-five years of stock market data, including time scales from half-hourly to yearly. In August 1938, he published the results of his studies in his book entitled "The Wave Principle". His revolutionary theory remains one of the most sophisticated methods for forecasting financial markets.
Later Elliott expanded his theory to apply to all collective human behaviors. He published his studies in his book "Nature's Law –The Secret of the Universe" in June 1946.
The Elliott Wave Principle is a technical analysis technique that enables analysis of financial market cycles and forecasts market waves by identifying extremes in investors' psychology.
The Elliott Wave Principle assumes that collective investor psychology moves between optimism and pessimism in natural sequences. These mood swings create patterns revealed in the price movements of markets at every time scale.
|


|