| Home > Technical Analysis Tutorial > Candlestick Patterns
|
Candlestick Trading Strategies
|
Candlestick Trading Strategies and Techniques
|
|
Using candlestick patterns to identify the potential trend direction is only the first step to building a successful trading strategy. The strategy should include the trade entry point, stop-loss and risk management, and the profit taking strategy.
|
Trade entry points
|
While some traders consider the next business day market open price as a trade entry point, some traders wait for additional confirmations like higher volume or price movement. Our research shows that waiting for the signal confirmation might improve the signal reliability, but most of the time, delaying the trade entry point would decrease the trade profitability, Risk/Reward, and Gain/Loss ratios.
Instead of waiting for additional signal confirmations, traders can consider candlestick pattern signals in conjunction with other technical indicators like the relative strength index (RSI), moving average, Parabolic SAR, Bollinger Band, and the moving average convergence divergence (MACD) as well as chart patterns and Elliott Wave Analysis. Our research shows that this technique improves the signals' reliability and trade profitability. We provide more information on this strategy further when we review each candlestick pattern's details.
|
Stop-loss and risk management
|
 It is important to place the stop-loss order simultaneously with the trade entry order to limit the potential losses in case of unexpected price movement. The stop-loss price depends on the traders' risk tolerance. The risk equals the difference between the trade entry price and the stop-loss price. The higher this value, the higher the risk, but if this value is too low, the trader risks getting stopped out prematurely.
Some traders recommend placing a stop-loss order just below the lowest low in the candlestick pattern. The lowest point of the low shadow or low of the real body of the last candle could be used as a stop-loss as well, to reduce risk even more. This approach for stop-loss price may not work well for some bullish candlesticks (for example Gravestone Doji or Matching Low) that have the pattern close price near or almost equal to the pattern low price. In this case the difference between the trade entry price and the stop-loss price might be too small or even equals zero and the risk of getting stopped out is too high.
For bullish candlesticks, the buy signal is invalid if the trade entry price (next business day opening price) is lower than the strategy stop-loss price. For bearish candlesticks, the entry point is invalid if the entry price is higher than the stop-loss price.
|
Profit taking strategy
|
 The profit taking strategy is an important part of every trading plan. Unlike other chart patterns, candlesticks patterns don't have a price target. Some traders use the preceding wave's 50% Fibonacci retracement as a target, or use technical indicators to find an exit point. Another strategy is to use other technical indicators and signals, for example to sell when the price drops below a chosen moving average.
|
Back Testing Candlestick Trading Strategies
|
|
Our candlestick research bask tested different trading strategies on more than four hundred thousand daily candlesticks and about two hundred thousand bullish and bearish candlesticks formed by the S&P 500 index members in daily and weekly waves over a period of more than thirty years. We analyzed many different candlesticks trading techniques that vary in calculating trade entry points, stop-loss levels, and trade exit strategies. Our research shows that one of the best performing tested techniques was a Candlestick/SAR (Stop and Reverse) strategy that uses the Parabolic SAR trading signals as the trade exit points. Below, we provide a set of rules that we used to evaluate this technique.
|
Candlestick/SAR Trading Rules
|
Candlestick/SAR Trading Rules
1 Open a long (for bullish pattern) or short (for bearish pattern) position on the market open price the next business day after the candlestick formation.
2 Set the stop-loss price:
| |
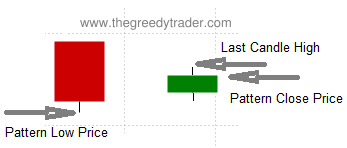
a. For the bullish candlesticks, if the difference between the last candle high and close price is smaller than the difference between the pattern close and low price, then the stop-loss price should be equal to the pattern low. Otherwise, the stop-loss price should equal the pattern low plus the close price, minus the last candle high.
|
| |
|
Pc - Pattern Close Price
Pl - Pattern Low Price
Ph - Last Candle High
PSL - Stop-Loss Price
If Ph - Pc < Pc - Pl
Then PSL = Pl
Else PSL = Pl + Pc - Ph
|
|
|
b. For bearish candlesticks, if the difference between the pattern high and close price is bigger than the difference between the last candle close and low price, then the stop-loss price should equal the pattern high. Otherwise, the stop-loss price should equal the pattern high plus the close price, minus the last candle low.
|
|
|
|
Pc - Pattern Close Price
Ph - Pattern High Price
Pl - Last Candle Low
PSL - Stop-Loss Price
If Ph - Pc > Pc - Pl
Then PSL = Ph
Else PSL = Ph + Pc - Pl
|
|
3 If, on the next business day after the pattern, the open price is lower (for bullish patterns) or higher (for bearish patterns) than the stop-loss price, the candlestick trading signal is invalidated.
|
Example: Stop-loss technique.
|
The image above shows a chart of Boeing Company (BA), where a daily Piercing Line candles pattern was formed on February 5th - February 6th, 2018. The pattern signaled the reversal of the daily downtrend that started on February 1, 2018.
Following is a comparison of two trading scenarios with different stop-loss approaches.
| Candlestick/SAR technique |
Ricky stop-loss technique |
February 7, 2018:
- Buy on market open at $340.52
- Set stop-loss at $317.39 (the pattern low).
April 13, 2020:
- Sell at $13.75
- Gain: 0.38%
|
February 7, 2018:
- Buy on market open at $340.52
- Set stop-loss at $320 (February 6th open price).
February 9, 2020:
- Sell at stop-loss price $320
- Loss: 6.7%
|
|


|