| Home > Technical Analysis Tutorial > Candlestick Patterns
|
Bullish Belt Hold
How to identify a Bullish Belt Hold Candlestick Pattern
|
A Bullish Belt Hold candlestick pattern is a common one candle pattern. It appears more often in a downtrend and usually considered a reversal pattern.
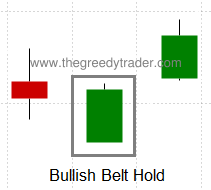
- Consists of one bullish candle that opens with a gap down from the previous day close.
- Candle has a long real body with a short upper shadow and no lower shadow.
|
Bullish Belt Hold Candlestick Pattern Reliability
|
Bullish Belt Hold pattern in a downtrend signals a trend reversal with an average reliability and has an average Gain/Loss ratio. In an uptrend, it is a continuation signal with an above average Gain/Loss ratio. A weekly Bullish Belt Hold is a very rare pattern.
In a downtrend the oversold momentum indicators improve reliability and profitability of the patterns' reversal signal. The following technical indicators improve reliability and profitability of a downtrend patterns' reversal signal as well:
- Price below Parabolic SAR
- Price below 20, 50, and 100 Day Moving Averages
- Price near the Lower Bollinger Band
In a rising trend all mentioned above technical indicators also improve pattern's continuation signal profitability.
|
Daily Patterns |
| Frequency |
Above Average |
| Appears in downtrend |
73% |
| Reversal in downtrend |
31% |
| Reversal in downtrend when parent trend is up |
56% |
| Reversal in downtrend when parent trend is down |
22% |
| Continuation in uptrend |
76% |
| Continuation in uptrend when parent trend is up |
92% |
| Continuation in uptrend when parent trend is down |
36% |
| Avg. Gain/Loss Ratio in Downtrend |
1.20 |
| Avg. Gain/Loss Ratio in Uptrend |
1.89 |
|
Bullish Belt Hold Trading Tips and Techniques
|
Using momentum technical indicators in conjunction with the bullish Belt Hold pattern may improve the reversal signal reliability and trade profitability. Selecting signals where the stock Relative Strength Index (RSI) is lower than 40% would improve the signal's reliability by almost 30% and Gain/Loss Ratio by more than 63%. Filtering stocks with Lane's Stochastic (%D-Slow) less than 45% would improve the signal's reliability by more than 60% and Gain/Loss Ratio by more than 58%. Selecting stocks with bullish Belt Hold pattern and with William's Percentage Range (W%R) greater than 65%, would improve the signal's reliability by more than 39% and Gain/Loss Ratio by more than 39%.
|
Bullish Belt Hold Examples
|
|
Example #1: Daily downtrend reversal signal.
| HON: Honeywell Int'l Inc.
|
|
|
|
Above is a price chart of the Honeywell Int'l Inc. (HON). The bullish Belt Hold candlestick pattern was formed on April 2nd, 2007. The pattern was signaling the daily downtrend reversal and the beginning of a new daily rising trend. The Relative Strength Index (RSI) was 38.84%, Lane's Stochastic (%D-Slow) - 29.96%, and William's Percentage Range (W%R) was almost 100%.
The Candlestick/SAR technique generates the following trading signals:
April 3rd, 2007:
- Buy on market open at $46.27.
- Set stop-loss at $45.58 (the pattern low).
|
May 19th, 2007:
- Sell at $58.04.
- Gain: 25.43% in 34 business days.
|
Example #2: Daily uptrend continuation signal.
The following price chart of Parker-Hannifin (PH) shows a daily rising trend that started on March 1, 2007. After a temporary price retreat, a Bullish Belt Hold pattern was formed on April 26, 2007 as an uptrend continuation signal.
The Candlestick/SAR technique generates the following trading signals:
April 27, 2007:
- Buy on market open at $60.38667.
- Set stop-loss at $59.47334 (the pattern low).
|
June 6, 2007:
- Sell at $88.41.
- Gain: 11.42% in 26 business days.
|
|


|