| Home > Technical Analysis Tutorial > Candlestick Patterns
|
Bullish Gravestone Doji Pattern
How to identify a Bullish Gravestone Doji
|
The bullish Gravestone Doji is a two-candle formation that appears mostly in downtrends.
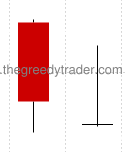
- The pattern consists of two candles.
- The first candle is bearish.
- The second candle is a Doji (the open price equals the close price) candle with long upper shadow and without lower shadow.
|
Bullish Gravestone Doji Candlestick Pattern Reliability
|
|
The weekly bullish Gravestone Doji is an extremely rare pattern. The daily bullish Gravestone Doji in a daily downtrend is a reversal candlestick pattern with average reliability. In rising trends, it is a continuation candlestick pattern with above average reliability. The bullish Gravestone Doji is one of the most profitable candlestick patterns with one of the highest average Gain/Loss Ratios (4.1) when using it in daily uptrends as a continuation signal with the Candlestick/SAR trading technique. Daily bullish Gravestone Doji signals are more reliable if the weekly trend is up.
|
|
Daily Patterns |
| Frequency |
Above Average |
| Appears in downtrend |
66% |
| Reversal in downtrend |
23% |
| Reversal in downtrend when parent trend is up |
56% |
| Reversal in downtrend when parent trend is down |
11% |
| Continuation in uptrend |
57% |
| Continuation in uptrend when parent trend is up |
91% |
| Continuation in uptrend when parent trend is down |
7% |
| Avg. Gain/Loss Ratio in Downtrend |
1.8 |
| Avg. Gain/Loss Ratio in Uptrend |
4.1 |
|
Bullish Gravestone Doji Trading Tips and Techniques
|
Since the second candle in the bullish Gravestone Doji is a Doji where the low price equals the close price, the pattern close price is near or equal to the pattern low. In those cases, using a pattern low as a stop-loss level is too risky. Usually, for Gravesone Doji patterns, our Candlestick/SAR trading strategy recommends setting a stop-loss level equal to the pattern low plus the close price minus the last candle high.
Pc - Pattern Close Price
Pl - Pattern Low Price
Ph - Last Candle High
PSL - Stop-Loss Price
PSL = Pl + Pc - Ph
The daily pattern reversal signal reliability and profitability is slightly better when momentum technical indicators are in the oversold area, or the price is below the Parabolic SAR. The price being close to the Lower Bollinger Band improves the daily downtrend reversal signal reliability by 19% and Gain/Loss ratio by 14%. The price being below the 20, 50 and 10 Day Moving Average does not substantially improve reliability and profitability.
|
Bullish Gravestone Doji Examples
|
|
Example #1: A continuation signal in a daily rising trend
The Bullish Gravestone Doji pattern below is an example of a continuation signal in a rising trend.
The charts above show the Lennar Corp. (LEN) rising daily trend that started on December 7, 2017. The Gravestone Doji candles pattern formed on December 11th and 12th was a continuation signal for the daily rising trend that continued until January 22, 2018.
The Candlestick/SAR technique generates the following trading signals:
December 13, 2017:
- Buy on market open at $61.71.
- Set stop-loss at $60.49, derived as the pattern low ($61.35) plus close price ($61.43) minus last candle high ($62.29). PSL = Pl + Pc - Ph = $61.35 + $61.43 - $62.29 = $60.49
|
January 24, 2018:
- Sell at $70.53.
- Gain: 14.29% in 28 business days.
|
Example #2: Daily downtrend reversal signal.
The chart of Laboratory CP (LH) below shows an example of the downtrend reversal Bullish Gravestone Doji pattern signal. The daily downtrend started on April 7th, 2000. The bullish Gravestone Doji pattern was formed by two daily candles on Friday, April 14 and Monday, April 17 2000. The pattern low on April 14th marked the end of the daily downtrend and the beginning of the new daily rising trend that continued until May 16th, 2000. The price on April 17 was below the 20 and 50 day Moving Average and close to the Lower Bollinger Band.
The American Airlines Group (AAL) chart above shows a daily uptrend that started on October 26, 2016 at $38.21. After a bullish week, the uptrend retreated for several days and then formed a Piercing Line pattern on November 3rd - November 4th. The pattern marked the end of a short term price retreat and a continuation of a daily uptrend.
The Candlestick/SAR technique generates the following trading signals:
April 18, 2000:
- Buy on market open at $10.325.
- Set stop-loss at $9.825, derived as the pattern low ($10.15) plus close price ($10.15) minus last candle high ($10.475). PSL = Pl + Pc - Ph = $10.15 + $10.15 - $10.475 = $9.825
|
May 19, 2000:
- Sell at $17.548.
- Gain: 69.96% in 22 business days.
|
|


|