| Home > Technical Analysis Tutorial > Candlestick Patterns
|
Bullish Doji Star
How to identify a Bullish Doji Star Candlestick Pattern
|
A bullish Doji Star is a common two-day candlestick pattern that mostly appears in a downtrend.
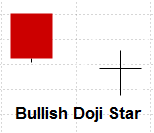
- The pattern consists of two candles.
- The first candle is a bearish candle with a long real body.
- The second candle is a Doji candle that opens below the first candle closing price and has small or no real body with nearly equal open and close price.
|
Bullish Doji Star Candlestick Pattern Reliability
|
A bullish Doji Star is usually considered a reversal pattern. The reliability of a trend reversal is higher when the previous candle is bearish with a long real body, and when there is a down gap between the previous candle close and the pattern's first candle open price.
A bullish Doji Star is a pretty common two-day candlestick pattern that appears mostly in a downtrend. Usually it is considered a reversal pattern. Our research shows that daily bullish Doji Star pattern signals a daily downtrend reversal with an average reliability. A weekly pattern downtrend reversal signal has an above average reliability. For both daily and weekly patterns, the signal reliability almost doubles if a parent's trend is up.
In rising trend, a Bullish Doji Star pattern may signal a bearish reversal, especially if a parent trend is down.
|
Daily Patterns |
Weekly Patterns |
| Frequency |
Above Average |
Above Average |
| Appears in downtrend |
70% |
78% |
| Reversal in downtrend |
27% |
46% |
| Reversal in downtrend when parent trend is up |
50% |
89% |
| Reversal in downtrend when parent trend is down |
22% |
29% |
| Continuation in uptrend |
48% |
19% |
| Continuation in uptrend when parent trend is up |
80% |
57% |
| Continuation in uptrend when parent trend is down |
8% |
3% |
| Avg. Gain/Loss Ratio in Downtrend |
1.46 |
1.5 |
| Avg. Gain/Loss Ratio in Uptrend |
2.75 |
1.19 |
|
Bullish Doji Star Trading Tips and Techniques
|
When a second candle in the bullish Doji Star is Doji with a small lower shadow, the pattern close price is pretty near to the pattern low. In those cases, using a pattern low as a stop-loss level is too risky, and our Candlestick/SAR trading strategy recommends setting a stop-loss level equal to a pattern low price plus close price minus pattern high.
Some traders prefer to wait for the next candle following the pattern to confirm the trend reversal. The body of this candle might be above the Doji candle body or might close a gap between first and second candles of the pattern to confirm the beginning of a rising trend. Our research shows that pattern reversal signal is slightly more reliable, if a next day open price is above the Doji candle body. A reversal signal is significantly more reliable, if a next day closing price is above the Doji candle body, but waiting for a next day close may have negative effect on Gain/Loss Ratio, since buying later at a higher price is reducing potential gain and increasing potential losses.
Our research shows that reliability of the Doji Star reversal signal does not noticeably improve when a price is closer to the Lower Bollinger Band, but in case of reversal, potential gains are higher, and it substantially increases a Gain/Loss Ratio.
|
Bullish Doji Star Examples
|
|
Example #1: Daily downtrend reversal signal
The price chart of the Northern Trust Corp. (NTRS) above shows the Bullish Doji Star candlestick pattern formed on October 2nd - 3rd, 2019. The pattern appeared in the daily downtrend and signaled an upcoming reversal of the current trend and the beginning of the new daily rising trend.
| NTRS: Northern Trust Corp.
|
|
|
|
The Candlestick/SAR technique generates the following trading signals:
October 4, 2019:
- Buy on market open at $87.06.
- Set stop-loss at $85.76 (the pattern low).
|
October 31, 2019:
- Sell at $98.79.
- Gain: 13.47% in 19 business days.
|
Example #2: Daily downtrend continuation signal.
The price chart of the American International Group, Inc. (AIG) below shows the Bullish Doji Star candlestick pattern formed on April 24 - 27, 2009. The pattern appeared in the daily rising trend during a short price retreat as a trend continuation signal.
| AIG: American International Group, Inc.
|
|
|
|
The Candlestick/SAR technique generates the following trading signals:
April 28, 2009:
- Buy on market open at $27.
- Set stop-loss at $26.4, derived as the pattern low ($27.2) plus the close price ($28) minus the last candle high ($28.8).
|
May 22, 2009:
- Sell at $32.6.
- Gain: 20.74% in 19 business days.
|
Example #3: Weekly downtrend reversal signal.
The following image shows a weekly bullish Doji Star candlestick pattern formed on Amphenol Corp. (APH) price chart between March 9 and March 20, 2020. The pattern presented a weekly downtrend reversal signal that marked a beginning of a new rising weekly trend.
The Candlestick/SAR technique generated the following trading signals:
March 23, 2020:
- Buy on market open at $68.94.
- Set stop-loss at $63.05 (the pattern low).
|
December 29, 2020:
- Sell at $128.11.
- Gain: 85.83% in 196 business days.
|
Example #4: Weekly downtrend continuation signal.
| RL: Polo Ralph Lauren Corp.
|
|
|
|
The image above shows a weekly bullish Doji Star pattern that appears on a price chart of a Polo Ralph Lauren Corp. (RL) between July 21 and August 1, 2008. The attern presented a continuation signal in a weekly uptrend indicating higher chances that the temporary price retreat is over, and a weekly uptrend will resume.
The Candlestick/SAR technique generated the following trading signals:
August 4, 2008:
- Buy on market open at $58.58.
- Set stop-loss at $55.15, derived as the pattern low ($57.19) plus the close price ($59.01) minus the last candle high ($61.05).
|
October 2, 2008:
- Sell at $64.33.
- Gain: 9.8% in 43 business days.
|
|


|