|
Home > Technical Analysis Tutorial > Chart Patterns
|
|
Chart Patterns
TheGreedyTrader Chart Pattern Tools
|
TheGreedyTrader.com provides chart patterns scanning tools that allow users to search chart patterns in daily, weekly, monthly, quarterly, and yearly time frames. The tools include:
- Chart Patterns Screener
- Advanced Technical Scanner, which allows searching stocks for specific trend directions, and chart patterns with specific technical conditions.
Chart Patterns Screener
Select a "Chart Patterns" item under the Alerts menu or click here to open the Chart Patterns Screener.
|
|
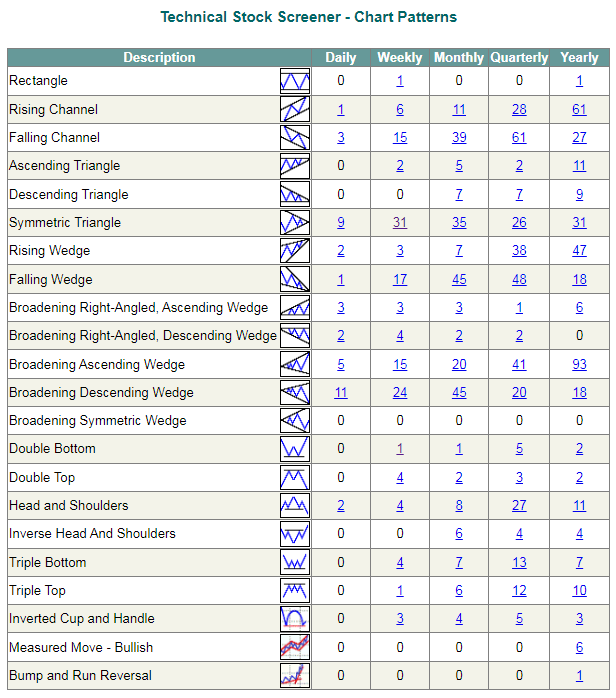
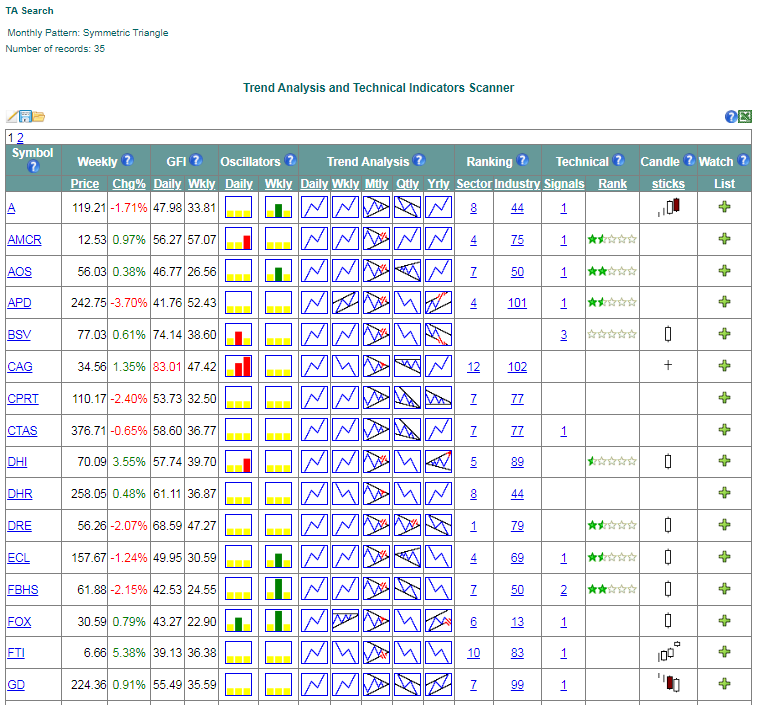
The Chart Patterns Screener shows a grid with the number of identified patterns in five different time frames. The number of identified patterns in the grid is a link to the Trend Analysis page, which presents a list of stocks that have the selected chart pattern in the selected time frame. For example, if the user clicks on the number of monthly Symmetric Triangle patterns, it will open the Trend Analysis screen below that filters stocks with the monthly Symmetric Triangle pattern. The icons in the Trend Analysis Monthly column indicate the pattern status, including the following statuses:
 - Valid Symmetric Triangle pattern with price between the patterns' support and resistance lines
 - Symmetric Triangle with broken resistance line
 - Symmetric Triangle pattern with price near the resistance line
 - Symmetric Triangle pattern with price near the support line
 - Symmetric Triangle with broken support line
|
|
The Trend Analysis grid has five Trend analysis columns that show chart pattern icons in five time frames. It shows current stock price, weekly price change, daily and weekly candlestick patterns, oscillators, and stocks' sector and industry ranks. The user can add selected stocks to the personal Watch List. You can find more details if you click here to go to the "How to use the Analysis page?" page.
Advanced Technical Scanner
The Advanced Technical Scanner allows users to create more sophisticated search criteria by adding chart pattern status, trend direction, and technical indicators criteria. To open the Advanced Technical Scanner, users can select the TA Search menu item under the Analysis menu or click here.
|
|
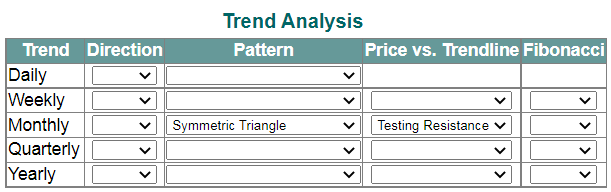
The Technical Analysis section of the scanner is located on the top right corner of the screen. Users can select the trend direction (Up or Down), chart pattern, and one of the following pattern statuses:
- Broken Resistance
- Testing Resistance
- Trading Range
- Testing Support
- Broken Support
|
|
|
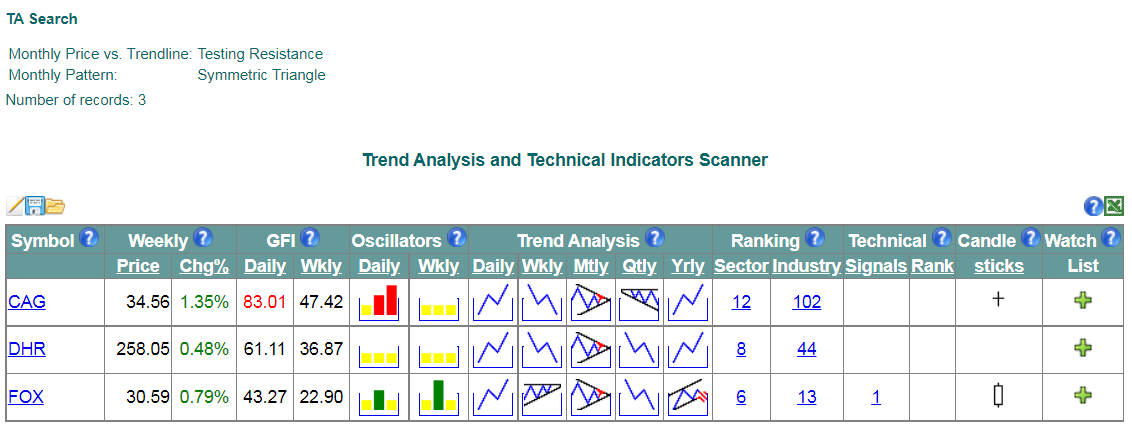
The image above shows the Technical Analysis section of the scanner, where a Testing Resistance Symmetric Triangle pattern is selected. After all filter criteria are selected, users can click the Submit button on the top right corner of the screen to see the search results on the next screen. The image below shows the search results corresponding to the criteria selected on the Advanced Technical Screener image above. The selected criteria are listed on the top left corner of the screen under the "TA Search" title. The grid below shows a list of stocks that match the selected criteria. The result is similar to the result for the Chart Patterns Screener section (shown above) for the monthly symmetric triangle chart pattern, but the list is much smaller than before since it shows only stocks that have price near the resistance line.
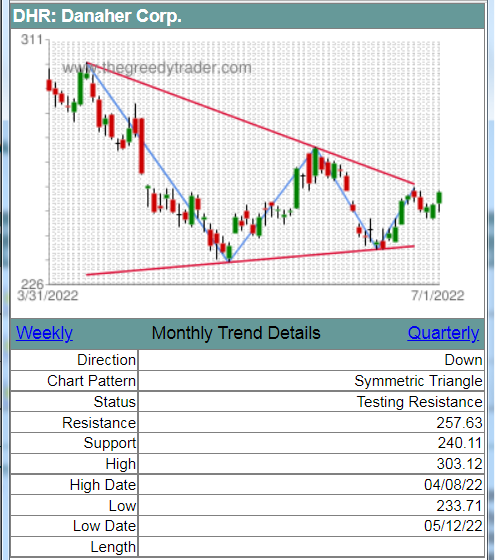
Users can click on the chart pattern icon to open the stock price chart pop-up screen, which shows the price chart with the patterns' sub waves, support and resistance trend lines, and trend details.
|
|
You can click here to find more information about how to use the Trend Analysis and Technical Indicators page.
|
 
|